Download
1 / 16
160 likes | 182 Vues
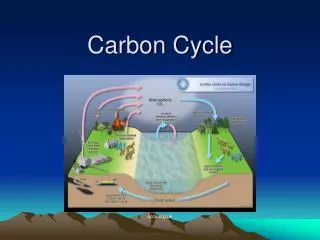
Carbon Cycle Atmospheric Observing System Status and Some Highlights. Insitu Aircraft, Tall Towers & Satellite Remote Sensing. Dave Hofmann ESRL Global Monitoring Division (formerly the Climate Monitoring & Diagnostics Laboratory) Chris Barnet

E N D
Carbon Cycle Atmospheric Observing SystemStatus and Some Highlights Insitu Aircraft, Tall Towers & Satellite Remote Sensing Dave Hofmann ESRL Global Monitoring Division (formerly the Climate Monitoring & Diagnostics Laboratory) Chris Barnet NESDIS Office of Research & Applications (to become the Center for Satellite Applications and Research) Climate Working Group Meeting March 30, 2006
ESRL/GMD GLOBAL COOPERATIVE CO2 NETWORK insitu aircraft and tall tower network
NACP Mid-Continent Intensive WLEF - Wisconsin • A project of the U.S. North American Carbon Program. • An attempt to reach agreement on carbon budgets between the “bottom-up” (crop, soil and forest inventories) and the “top-down” (aircraft and tall tower measurements used with inverse transport model) techniques. • Planned for the 2007 growing season in the Midwest.
NOAA ESRL Tall Tower & Aircraft North American Network Tower Aircraft Continuous Observations: CO2, CO, horizontal wind, T, RH 3 levels: 30, 100, 500m PAR, Rainfall, Surface Pressure Flask Samples: Daily mid-afternoon from top level (+5 extra per week) Species: CO2, CO, CH4, N2O, SF6, 13C, 14C isotopes, halocarbons, COS Continuous Observations: CO2 and O3 on some flights Flask Samples: Weekly Species: CO2, CO, CH4, N2O, SF6, 13C, 14C isotopes, halocarbons, COS GPS, temperature, pressure
Existing Sites Phase III Phase I Phase IV Phase II NOAA/ESRL Tall Tower Projected Network Expansion
Carbon Cycle Atmospheric Observing SystemStatus End of FY2005 • 17 aircraft sampling sites • 3 tall tower sites Plans for FY2006 • 5 new aircraft sites • 3 new tower sites (NACP MCI* support) FY2006 Actual (30% funding reduction) • no new aircraft sites • 3 temporarily discontinued aircraft sites • possibly one new tower site in the midwest (working on partnering agreement with Harvard for an MCI tower) * MCI – Mid-Continent Intensive
AIRCRAFT SITES - 2006 Flask samples at 12 altitudes to ~ 8 km Site Location (Airport Location) Date of First Data # of Profiles (1-2006) Carr, CO (Boulder, CO) 11/1992 405 Park Falls, WI (Phillips, WI) 4/1998 87 Poker Flat, AK (Fairbanks, AK) 6/1999 79 Harvard Forest, MA (Beverly, MA) 11/1999 77 Estevan Point, Canada (Tofino, B.C.) 11/2002 63 Summerville, SC (Summerville, SC) 8/2003 18 Trinidad Head,CA (Brookings, OR) 9/2003 39 Sinton, TX (Sinton, TX) 9/2003 52 Isles of Shoals, NH (Northboro, MA) 9/2003 47 Rowley, IA (Ames, IA) 9/2004 36 Bradgate, IA (Ames, IA) 9/2004 33 Dahlen, ND (Ames, IA/Fargo, ND) 9/2004 41 Beaver Crossing, NE (Ames, IA) 9/2004 36 Fairchild, WI (Ames, IA) 9/2004 32 Oglesby, IL (Ames, IA/Peru, IL) 9/2004 39 Homer, IL (Ames, IA/Peru, IL) 9/2004 45 Cape May, NJ (California, MD) 8/2005 18 BERMS Site, Canada (LaRonge, SK) 10/2005 7 FY06 temporarily discontinued sites Sites supporting the NACP Mid-continent intensive
Satellite Retrieval of Atmospheric CarbonChris Barnet & Mitch Goldberg, NESDIS/ORA • High spectral resolution operational thermal sounders have the capability of measuring temperature, moisture, clouds, O3, CO, CH4, and CO2, HNO3, and N2O globally for the next 20+ years. • Measurements of carbon gases are in a thick layer column centered about 200 mb in the tropics and 500 mb at high latitudes. • Precision is about 2 ppm for CO2 and 20 ppb for CH4. • NOAA/NESDIS is exploiting existing weather satellites. • Enhancing core algorithms for carbon gas context (e.g., temperature & moisture) • Developing & comparing algorithms for deriving atmospheric trace gases. • Comparing AIRS (launched May 4, 2002) derived products to in-situ measurements (ESRL/GMD and JAL aircraft). • Preparing for METOP/ IASI (June 30, 2006) & NPP/ CrIS (2009) • Budget constraints impact efforts to evaluate and promote products. • Will pursue other funding avenues (e.g., NASA ROSES, NOAA Cal/Val for satellites). • Lack of product assessment will eventually lead to the product having (a) no impact to the Carbon community or (b) non-US lead on publications and ingestion of these products into models.
Algorithm Evaluation and Preliminary Products CO2 product is most difficult: preliminary analysis is promising CH4 CO2 (ppm) 385 380 375 370 365 July 2004 Fires CO CO2 O3 AIRS CO2 2003 20042005 Regional & zonal time series: Alaska & Canadian Zone (60 lat 70 & -165 lon -90) for Aug. 2003 - Dec. 2005 In-situ Aircraft
Highlights of NOAA’s Climate Forcing Program A decreasing trend in Northern Hemisphere carbon dioxide uptake 1996 -2004. Recent increases in the north-south gradient of atmospheric CO2 at continental Northern Hemisphere measurement sites of the NOAA/ESRL Global Air Sampling Network reveal a shrinking terrestrial carbon sink. Seven of nine sites strongly influenced by terrestrial carbon fluxes show differences with the South Pole increasing faster than can be explained by fossil fuel emissions, resulting in an average north-south difference at these sites 1.7 ppm larger in 2004 than in 1996. Analysis of atmospheric 13CO2 also indicates a decline in terrestrial carbon uptake. Although the persistence of this trend is uncertain, the analysis shows that large changes in net fluxes of terrestrial carbon can occur rapidly and may be sensitive to changes in climate.(Miller et al, Science, revision submitted, 2006)
Highlights of NOAA’s Climate Forcing Program Global distribution and seasonality of atmospheric carbonyl sulfide (COS) Results from a ground- and aircraft-based air sampling network suggest that the distribution and seasonality of COS throughout most of the Northern Hemisphere is driven by vegetative uptake in a mechanism parallel to the uptake of CO2 during photosynthesis. It follows that studies of COS may provide unique constraints on carbon assimilation by the terrestrial biosphere. Furthermore, because COS is not emitted in copious amounts by vegetation, as is CO2, studies of COS may provide direct insights into CO2 fluxes to vegetation. NOAA’s measurements of COS show uptake by vegetation during the growing season. The stations to the left are Mauna Loa Observatory, Hawaii (MLO), Colorado mountains (NWR), Wisconsin woodlands (LEF), Pt. Barrow Observatory, Alaska (BRW), and Harvard forest, Massachusetts (HFM). As with CO2, uptake is largest in heavily vegetated regions but the effects reach the Arctic through transport with a 1-2 month delay.
Status of CCSP Synthesis and Assessment Product (SAP) 2.2 • North American carbon budget and implications for the global carbon cycle • [also known as the prototype State of the Carbon Cycle Report (SOCCR) focused on North America] • Currently in production through a contract to the Oak Ridge National Laboratory. • 7 Coordinating Authors, 31 Lead Chapter Authors, 15 Chapters in 3 Parts. • Lead Agencies: DOE, NASA, NOAA • Lead Agency for IQA/FACA: NOAA • Supporting Agencies: USDA, USGS • Milestones: • Prospectus Approved: 2/2006 • Draft to NOAA for peer review: 5/2006 • Revised draft to NOAA for public review and comment: 9/2006 • Complete and deliver to NOAA: 1/2007 • CCSP and NSTC review completed and SAP 2.2 released: 3/2007
Synthesis & Assessment Product 2.2 (SOCCR) Table of Contents Chapter 1. Introduction to the Report’s Purpose, Scope, and Structure: What is the carbon cycle and why should we care? (authors: SOCCR Coordinating Team) PART I: THE CARBON CYCLE IN NORTH AMERICA Chapter 2. How do North American carbon sources and sinks relate to the global carbon cycle? (lead authors: Chris Field (Coordinating Lead), Burke Hales, Jorge Sarmiento, and others) Chapter 3. What are the primary carbon sources and sinks in North America, how are they changing and why? (lead authors: Steve Pacala and Steve Wofsy (Coordinating Leads), Ken Davis, Burke Hales, Richard Houghton, Pieter Tans, and others) Chapter 4. What are the options and measures that could significantly affect the carbon cycle? (lead authors: Erik Haites (Coordinating Lead), Ken Caldeira, Patricia Romero Lankao, Adam Rose, Tom Wilbanks) Chapter 5. How can we improve the application of scientific information to decision support for carbon management and climate decision-making? (lead authors: Lisa Dilling and Ron Mitchell (Coordinating Leads), David Fairman) PART II: ENERGY, INDUSTRY, AND WASTE MANAGEMENT ACTIVITIES Overview of Part II: Title (to be determined); (author: Gregg Marland) Chapter 6: Energy Extraction and Conversion (lead author: Gregg Marland) Chapter 7: Transportation (lead author: David Greene) Chapter 8: Industry and Waste Management (lead author: Mark Jaccard) Chapter 9: Buildings (lead author, James McMahon) PART III: LAND AND WATER SYSTEMS Overview of Part III: Title (to be determined); (author: Richard Houghton) Chapter 10. Agriculture, Grassland, Shrubland and Arid Lands (lead authors: Keith Paustian, Rich Conant) Chapter 11. Forests (lead authors: Mark Johnston, Jennifer Jenkins, Richard Birdsey, and Elisabeth Huber-Sannwald) Chapter 12. Carbon Cycle in Permafrost Regions (i.e., Boreal, Subarctic and Arctic Areas) of North America (lead author: Charles Tarnocai) Chapter 13. Non-Permafrost Wetlands (lead author: Scott Bridgham) Chapter 14. Human Settlements and the North American Carbon Cycle (lead author: Diane Pataki) Chapter 15. Aquatic Carbon, Coastal Management, and Ocean Basins (lead authors: Francisco Chavez and Taro Takahashi)
The Future: Continue Monitoring in a Research Mode The CO2 growth rate is increasing - is it related to reduced uptake by the NH biosphere in the last 10 years? Resolution of the fractional ppm/yr growth rates requires high accuracy and impeccable calibration Can we explain most of the causes of the high degree of variability in the growth rate? Will the Earth continue to take up its 50% or so?
SUMMARY • Climate Program Funding Reductions (~30%) have had an unfortunate impact on NOAA support of a major NACP program (2006-2007Mid-Continent Intensive). • Partnering with other agencies and/or universities to obtain access to tall towers in the midwest is being investigated. • Increased costs are beginning to impact operations of the NOAA Baseline Observatories (Barrow, Alaska, Mauna Loa, Hawaii, Trinidad Head, CA, American Samoa, South Pole Station). • Overall, the global network is healthy but not expanding to under-sampled regions as originally planned.
1-Day >10-3 3-Day Log (ppm/ (moles/m2/s)) >10-3 5-Day >10-3 12-TOWER NETWORK FOOTPRINTS Trajectory-flux based footprints for the planned tower network. A threshold has been applied to the right panel to highlight sensitivity differences that are otherwise difficult to see on the logarithmic color scale.