Download
1 / 16
160 likes | 338 Vues
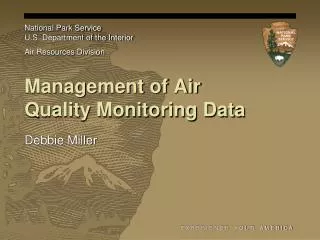
National Park Service U.S. Department of the Interior Air Resources Division. Management of Air Quality Monitoring Data. Debbie Miller. Overview. The NPS has a mandate to protect air quality and related values in national parks

E N D
National Park Service U.S. Department of the Interior Air Resources Division Management of Air Quality Monitoring Data Debbie Miller E X P E R I E N C E Y O U R A M E R I C A
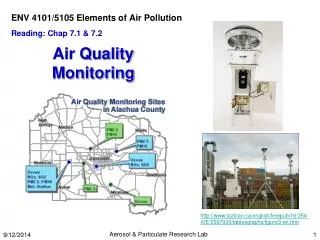
Overview • The NPS has a mandate to protect air quality and related values in national parks • The Environmental Protection Agency establishes air quality standards for six criteria pollutants that must be met nationwide • The Air Resources Division uses monitoring data to assess air quality conditions at parks across the country E X P E R I E N C E Y O U R A M E R I C A
Overview (cont) Some parks receive special protection under the Clean Air Act; most NPS-funded monitoring occurs in these “Class I” areas Some monitoring in parks is funded by other agencies ARD also uses data from monitors outside parks E X P E R I E N C E Y O U R A M E R I C A
Air Quality Monitoring Data • Types of data include: • 24-hour particulate concentrations (every 3rd day) • weekly wet deposition • hourly ozone concentrations • hourly meteorological measurements • weekly ozone concentrations • weekly particulate concentrations • weekly dry deposition • hourly SO2, NO, NO2, CO concentrations • hourly light extinction and scattering measurements E X P E R I E N C E Y O U R A M E R I C A
Data Handling • Most NPS raw data are collected by contractors • Continuous ozone and meteorology data are validated by contractor and uploaded to national EPA air quality database • Particulate samples are analyzed by different labs, data collected and stored by contractor • Wet deposition samples managed by National Atmospheric Deposition Program • Dry deposition data collected and maintained by EPA contractor • Non-NPS data are collected and validated by states, tribes, and local air quality agencies E X P E R I E N C E Y O U R A M E R I C A
Data Processing • Many summary statistics are created from raw data • Used to evaluate status of parks and trends in data • Examples include: • annual 4th-highest 8-hour ozone concentration • 3-year average of the annual maximum 3-month ozone W126 sum • mean annual visibility on 20% best and 20% worst days • number of days exceeding ozone standard • annual mean wet deposition concentrations and deposition • maximum 3-month ozone SUM06 E X P E R I E N C E Y O U R A M E R I C A
Data Processing ARD creates many of the calculated statistics Data ingested from various sources using SAS statistical software Programs generate various ozone and visibility statistics Other statistics such as deposition parameters created by other agencies ARD stores a large amount of raw and processed data for quick access E X P E R I E N C E Y O U R A M E R I C A
Limitations Most raw data available through some type of on-line retrieval system; not all are public Some calculated statistics available, but many are not Retrievals require fair degree of expertise Must be able to ingest and process large text files No consistent file format Must visit different web sites Current system results in duplication of efforts E X P E R I E N C E Y O U R A M E R I C A
EPA Data Format # RD|ActionCode|StateCode|CountyCode|SiteID|Parameter|POC|SampleDuration|Unit|Method|Date|StartTime|SampleValue|Null Data Code|SamplingFrequency|Monitor Protocol (MP) ID|Qualifier - 1|Qualifier - 2|Qualifier - 3|Qualifier - 4|Qualifier - 5|Qualifier - 6|Qualifier - 7|Qualifier - 8|Qualifier - 9|Qualifier - 10|Alternate Method Detectable Limit|Uncertainty # RC|ActionCode|StateCode|CountyCode|SiteID|Parameter|POC|Unit|Method|Year|Period|Number of Samples|CompositeType|SampleValue|Monitor Protocol (MP) ID|Qualifier - 1|Qualifier - 2|Qualifier - 3|Qualifier - 4|Qualifier - 5|Qualifier - 6|Qualifier - 7|Qualifier - 8|Qualifier - 9|Qualifier - 10|Alternate Method Detectable Limit|Uncertainty RD|I|01|003|0010|44201|1|1|007|047|20080301|00:00||BF|||||||||||||| RD|I|01|003|0010|44201|1|1|007|047|20080301|01:00|0.011||||||||||||||| RD|I|01|003|0010|44201|1|1|007|047|20080301|02:00|0.014||||||||||||||| RD|I|01|003|0010|44201|1|1|007|047|20080301|03:00|0.012||||||||||||||| RD|I|01|003|0010|44201|1|1|007|047|20080301|04:00|0.001||||||||||||||| RD|I|01|003|0010|44201|1|1|007|047|20080301|05:00|0.002||||||||||||||| RD|I|01|003|0010|44201|1|1|007|047|20080301|06:00|0.001||||||||||||||| RD|I|01|003|0010|44201|1|1|007|047|20080301|07:00|0.014||||||||||||||| RD|I|01|003|0010|44201|1|1|007|047|20080301|08:00|0.030||||||||||||||| RD|I|01|003|0010|44201|1|1|007|047|20080301|09:00|0.043||||||||||||||| RD|I|01|003|0010|44201|1|1|007|047|20080301|10:00|0.041||||||||||||||| RD|I|01|003|0010|44201|1|1|007|047|20080301|11:00|0.045||||||||||||||| RD|I|01|003|0010|44201|1|1|007|047|20080301|12:00|0.047||||||||||||||| RD|I|01|003|0010|44201|1|1|007|047|20080301|13:00|0.048||||||||||||||| RD|I|01|003|0010|44201|1|1|007|047|20080301|14:00|0.051||||||||||||||| RD|I|01|003|0010|44201|1|1|007|047|20080301|15:00|0.052||||||||||||||| RD|I|01|003|0010|44201|1|1|007|047|20080301|16:00|0.053||||||||||||||| RD|I|01|003|0010|44201|1|1|007|047|20080301|17:00|0.047||||||||||||||| RD|I|01|003|0010|44201|1|1|007|047|20080301|18:00|0.041||||||||||||||| RD|I|01|003|0010|44201|1|1|007|047|20080301|19:00|0.036||||||||||||||| RD|I|01|003|0010|44201|1|1|007|047|20080301|20:00|0.015||||||||||||||| RD|I|01|003|0010|44201|1|1|007|047|20080301|21:00|0.010||||||||||||||| RD|I|01|003|0010|44201|1|1|007|047|20080301|22:00|0.003||||||||||||||| RD|I|01|003|0010|44201|1|1|007|047|20080301|23:00|0.005||||||||||||||| E X P E R I E N C E Y O U R A M E R I C A
The Future • Development of consolidated data access application underway • Use existing databases where possible • Add information not already present (additional metadata, calculated parameters, etc.) • New park-centered interface—focus on specific needs of NPS users • Fit into existing IRMA structure • Add report-ready products (plots, tables, etc.) E X P E R I E N C E Y O U R A M E R I C A
Data Locations CSU/VIEWS Visibility data/RHR results Hourly O3 (US), deposition, WX, other AQS data NADP Wet deposition Mercury deposition EPA/AQS (limited access) Hourly O3 (US) NPS O3 CASTNET (O3, dry dep) Met data (US) Other pollutants (SO2, NOx, toxics, etc) ARS/Ft Collins NPS O3 hourly Some calculated O3 Live O3 NPS met data Portable O3 Passive O3 New DB/query application ARD/Denver Hourly O3 (US) Trend results Interpolated data Mapping applications Metadata (site, park, usage notes) Calculated O3 parameters SAS programs Other data sets (?) E X P E R I E N C E Y O U R A M E R I C A
Air Resources Division Lakewood, Colorado http://www.nature.nps.gov/air/ 303-987-6947 National Park Service U.S. Department of the Interior E X P E R I E N C E Y O U R A M E R I C A