Download
1 / 67
670 likes | 1.1k Vues
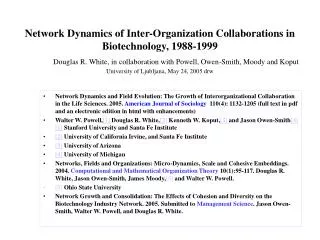
Network Dynamics of Inter-Organization Collaborations in Biotechnology, 1988-1999 Douglas R. White, in collaboration with Powell, Owen-Smith, Moody and Koput University of Ljubljana, May 24, 2005 drw.

E N D
Network Dynamics of Inter-Organization Collaborations in Biotechnology, 1988-1999Douglas R. White, in collaboration with Powell, Owen-Smith, Moody and KoputUniversity of Ljubljana, May 24, 2005 drw • Network Dynamics and Field Evolution: The Growth of Interorganizational Collaboration in the Life Sciences. 2005. American Journal of Sociology110(4): 1132-1205 (full text in pdf and an electronic edition in html with enhancements) • Walter W. Powell,[1] Douglas R. White,[2] Kenneth W. Koput,[3] and Jason Owen-Smith[4][1] Stanford University and Santa Fe Institute • [2] University of California Irvine, and Santa Fe Institute • [3] University of Arizona • [4] University of Michigan • Networks, Fields and Organizations: Micro-Dynamics, Scale and Cohesive Embeddings. 2004. Computational and Mathematical Organization Theory 10(1):95-117. Douglas R. White, Jason Owen-Smith, James Moody,[5] and Walter W. Powell. • [5] Ohio State University • Network Growth and Consolidation: The Effects of Cohesion and Diversity on the Biotechnology Industry Network. 2005. Submitted to Management Science. Jason Owen-Smith, Walter W. Powell, and Douglas R. White.
The Evolution of Biotechnology as a Knowledge Industry: Network Movies and Dynamic Analyses • This is the article that came out in AJS last week Walter W. Powell Douglas R. WhiteStanford University UC Irvine Kenneth W. Koput Jason Owen-Smith University of Arizona Stanford University Slides by Douglas R. White Biotechnology as a knowledge-based industry involves extensive reliance on organizational learning. This occurs through networks of dense collaborative ties among organizations. We model the emergence of the industry networkof contractual collaborations from 1988-99 in relation to firm-level organizational and financial changes.
Organization of the TalkThe Five Hypotheses • Cumulative advantage – winners get more ties and more ties reap advantages • Follow the trend – follow the pack • Multiconnectivity – be cohesive • Homopholy – be like the winners – or else • Novelty – be different And how findings of the three central variables interact dynamically
Fig. 1: Life science patents assigned to biotechnology firms and research universities, 1976-1999
Fig. 2. Distribution of organizational forms and activities, 1998, 1993, 1998 DBF=Dedicated Biotech Firm PRO=Public Research Orgs VC=Venture Capital COMercial, LICensing, FINance, R&D
Early in the project • I changed the network Powell was studying from data in the BioScan industryjournal into a DBF x Partner (2-mode) network with a subset with complete information on DBF by DBF (1-mode) ties. • This made it possible to study the network statistically • And to visualize it through Pajek (Batagelj and Mrvar), using generate in time and exporting the results to a dynamic gif.
Network Visualization: 1988-99 • The following twelve slides show the evolution of collaborative contracts within the biotech industry looking at the complementarity of type ties and six types of organizations linked to biotech firms: • Green ties =Finance (two types of links were excluded here: • Red ties =Res&Dev licensing and commercialization) • NODES: • Grey =Finance (ignore darker grays) • LiteBlue =Biotech • Yellow =Pharmaceuticals • Orange =Res.Labs and Universities • DarkBrown =Government (e.g., NIH) • Pink =Miscellaneous • This version of the movie was done before recoding the data to combine firms that merged and shows a phase transition in connectivity that peaks in 1991
1988: Money is chasing ideas. Most R&D links are still informal. Only a few biotech products have been brought to market. Great promise, but not a lot of payoff at this point.
1989: Core participants in R&D begin to cohere; this nucleus of R&D attracts more investment.
1990: Several new biotech medicines are approved by U.S. FDA. Big jump in investment in R&D as excitement about feasibility of new search methods for “targeting” diseases builds.
1991: A phase transition appears to occur with an explosion of R&D, backed by previous venture capital.
1992: An altered landscape is in place, in which the participants in the center are tightly connected to one another and are linked to those on the edges, creating a field in which the circulation of resources happens readily.
1998: Further thinning of the center, new clusters forming on the edges? New transversal technologies are developing (e.g., genomics) that create new kinds of linkages and capabilities.
What’s Happening? Five hypotheses • Cumulative advantage – successful get more ties and more ties bring success (e.g., Barabási 2002) • Follow the trend – follow the pack • Multiconnectivity – link to more cohesive units to access resources and diversity in the field • Homophily – link with those like you, the winners, or – • Diversity – link with those who bring novelty and new skills, are not so committed
Is there cumulative advantage? (the possibility but not with certainty, would be indicated by log-log plots of link degree by their frequencies that are linear, as in Barabási, 2002, and the lower left plot) Fig. 3. Degree distributions (number of partners) by type of partners, all years
I II III IV I II III IV Temporal Trends: Attraction to hubs, transitions to connectivity and to increasing multiconnectivity among the DBFsy-axis: ratios to # of nodes - 1-mode data y- and x-axis: ratios to # of nodes 1988-89 bicomponents decline while components grow – I rate: - 85% 1989-93 bicomponents at 2/3s the rate of components – II – graph theoretic phase transition +67% 1993-98 bicomponents at 1/2s the rate of components – III (to multiconnectivity) +50% 1998-99 bicomponents grow while components decline – IV – phase transition intensifies Figure 2
88 1000 89 90 91 100 92 93 94 95 10 96 97 98 1 99 1 10 100 1-mode degree distribution by year: starts out nearly Barabási-like power law (88-91) and shifts to exponential (97-99); hypotheses – consistent with transition to cohesive choiceand an emerging market with dispersal and divesity Progressively more exponential (log-linear) dispersal towards 97-99 but also more extreme tails Outliers mostly conserve growth (see next slide) frequency degree 70 In earlier years rich in ties get richer, later changes to more random/dispersed distribution Power-law (log-log linear), moreso in 88-91
It seems like there is cumulative advantage, but • … because we had other hypotheses, we used statistical tests to distinguished which ones let to the formation of new ties and repeat ties with DBFs (1-mode) and other partners (2-mode) • McFadden’s conditional logit looks at discrete choices in tie-formation holding the network constant at each time, and testing predictions of competing hypotheses.
Dividing the Network into Two for Analysis • One-Mode Network: • Complete data on the 482 dedicated biotech firms (DBFs), focusing on research on medicines for humans (therapeutic or diagnostic biotechnology): 482x482 • Two-Mode Network: • DBFs reporting ties with non-DBF partners, including universities, research institutes, pharmaceuticals, financial, government, 482x2630 • Why not one big network? Ties among non-DBF partners are generally sparse or nonexistent, hence 2630 x 2630 data too difficult to collect and hence cannot analyze. • For both modes, we have new and repeat ties
In these results, an odds ratio of 1 is random. Hypothesis >1 means a positive effect is expected while <1 means a negative effect expected. Results consistent with our hypothesis is are in blue boxes, while opposite results are in red boxes. Accumulative advantage is not supported: I.e., Contra Barabasi.
As before, an odds ratio of 1 is random. Hypothesis >1 means a positive effect is expected while <1 means a negative effect expected. Results consistent with our hypothesis is are in blue boxes, while opposite results are in red boxes. Follow the trend is supported. But what are the trends if not accumulative advantage?
Emergence of the Cohesive Core • Does preferential attachment, not to individual hubs, but to partners in more multiconnected blocks generate: • the power-law distributions of degree? • the slow evolution of the largest component? • Reinforcement of a highly cohesive (multi-connected) core of the network? • phase transitions more highly multiconnected blocks? • The multiconnected core that emerges from the interconnection of R&D and Finance collaborations (out of a field of 2219 organizations) contains: • 147 organizations • each of the 147 has six or more node-independent paths connecting to every other organization in the core • this is a sexta-component, a very high level of structural cohesion • the core is “super-” conductive to resource and knowledge transfer – it is a high-speed highway for access to resource-rich partners.
Here is a tricomponent core (3-connected component) among the BioTechs for all time periods (note the position of Chiron)
3-component (red nodes) 2-component (adds green nodes) These are all the ties among DBF biotechs, showing those among the hubs or 3-core, the 2-core, and the 1-core: core centrality (e.g., Chiron) magnifies ties to outliers 1-component (adds yellow nodes)
A closer look at levels of connectivity Levels of Network Cohesion – three smaller graphs Within the connected Components (not shaded) are the Bicomponents (cohesive - medium shading) embedding the Tricomponents (more cohesive - dark shading). And so forth for higher k-components)
In this case the hypothesis of a preference towards cohesion (multiconnectivity of partner, and similar multiconnectivity) and towards diversity in the ties of the partner are strongly supported. Theideas that ties are selected because the firm and its partner will together have tie diversity, or that the partner’s partners have tie diversity are not supported,
There is more support here for diversity rather than for the homophily hypothesis
So what about tie diversity? • There seems to be a preference among core DBFs for ties with new entrants • And for existing firms with tie diversity • Lets look at the evolution of the core in terms of its diversity of types of tie and types of firms
Network Movie: 1988-91-95-98 • The following four slides show in more detail the evolution of collaborative contracts within the biotech industry • Green ties =Finance (as before) • Red ties =Res&Dev (as before) • Pink ties =Licensing trials (now included) • Blue ties =Commercialization (now included) • NODES: • Cyan nodes =Biotech • DarkGray =Finance (hard to tell from the black!) • Yellow nodes =Pharmaceuticals • Orange =Res.Labs and Universities • Black =Government (e.g., NIH) • This version was done after recoding to combine firms that merged (it also has the phase transition in connectivity. • Here the k-components for each type of tie (k-cores) are shown as inserts
1988 2-core 2-core R&D Finance 3-core 2-core Commercialization Licensing
1989 Core Reaching Out Commercialization and licensing in the core, finance reaching out
1991 3-Core 2-Core R&D Finance 3-Core 2-Core Licensing Commercialization
1991 Core Reaching Out Finance integrated but differentiated from commercialization in the core, R&D reaching out
1995 3-core 2-core Finance R&D 2-core 2-core Commercialization Licensing
1995 Core Reaching Out It is now Finance and R&D (overlapping with Commercialization) that are integrated but differentiated in the core, R&D continues reaching out
1998 3-core 3-core Finance R&D 3-core 3-core Commercialization Licensing
1998 3-core Finance Finance hub has few Pharmas, many BioTechs and Venture Capital
1998 3-core Commercialization Commercialization hub has Pharmas and BioTechs, one Govt
1998 Licensing 3-core Licensing hub has Unis, Pharmas, BioTechs, a VC and a Govt
1998 3-core R&D R&D Hub has Govt, Unis, Pharmas, and BioTechs
We discovered the key to the dynamics of diversity and multiconnectivity • Only at the end of our first study • By flipping through Jason Owen-Smith’s Pajek drawings year by year, contrasting all ties (so as to see the cohesive core) and new ties (to see the preference for new entrants and novelty).
Cumulative ties, Biotech Flip these back and forth for sense of dynamics