ECOLOGY
1.48k likes | 1.94k Vues
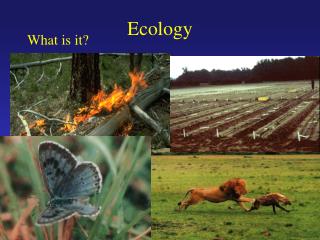
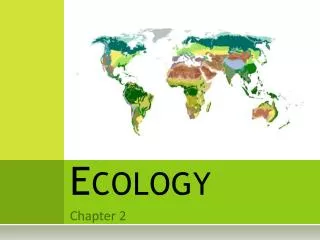
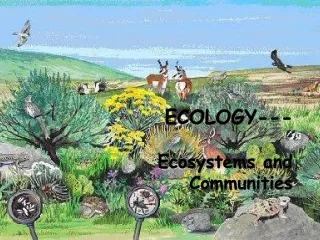
ECOLOGY. A study of the interactions of living organisms and the environment in which they live. A. Introduction. Ecology is the scientific study of the interactions between organisms and their environment. The environment of any organism includes the following components:

ECOLOGY
E N D
Presentation Transcript
ECOLOGY A study of the interactions of living organisms and the environment in which they live
A. Introduction • Ecology is the scientific study of the interactions between organisms and their environment.
The environment of any organism includes the following components: • Abiotic factors: non-living chemical and physical factors such as temperature, light, water, and nutrients • Biotic factors: the living components
B. Abiotic factors affect the distribution of organisms • Temperature: some organisms can only tolerate specific ranges of temperature. • Water: some organisms can only tolerate either fresh or salt water. • Sunlight provides energy that drives nearly all ecosystems. • The intensity and quality of light, and photoperiod can be important to the development and behavior of many organisms.
Wind amplifies the effects of temperature by increasing heat and water loss (wind-chill factor). • Rocks and soil: the physical structure and mineral composition of soils and rocks limit distribution of plants and the animals that feed upon them.
C. Approaches to studying ecology… • Organismal ecology is concerned with the behavioral, physiological, and morphologicalways individualsinteract with theenvironment. Fig. 50.2a
Population ecology: a population is a group of individuals of the same species living in a particular geographic area. • An example of a population could be gray squirrels living in Sea Cliff. • Population ecology examines factors that affect population size and composition.
Community ecology:a community consists of all the organisms ofall the species thatinhabit a particulararea. (all biotic) • An example of a community could be gray squirrels, raccoons, cardinals, chipmunks, and black crows living in Glen Head. Fig. 50.2c
Ecosystem ecology: an ecosystem consists of all the abiotic factors in addition to the entire community of species that exist in a certain area. • Example? All bullfrogs, minnows, snails, snapping turtles, algae in a pond and how ph, temperature, sunlight impact this life
D.Biomes can be aquatic or terrestrial • Marine biomes have a salt concentration of approximately 3% and cover approximately 75% of the earth’s surface. • Freshwater biomes are usually characterized by salt concentration of less than 1% and are closely linked to the soils and biotic components of the terrestrial biomes through which they pass.
Freshwater biomes (ponds and lakes, small and large freshwater). • The littoral zone is shallow and close to shore. • The limnetic zone is the open surface water. • The profundalzone consistsof the deep,aphotic regions.
Lakes • Oligotrophic lakes are deep, nutrient-poor and do not contain much life.
Mesotrophic have a moderate amount of nutrients and phytoplankton productivity. • Over long periods of time, oligotrophic lakes may become mesotrophic as runoff brings in nutrients. • Pollution from fertilizers can cause explosions in algae population and cause a decrease in oxygen content.
Streams and rivers are bodies of water moving continuously in one direction.
Wetlands are areas covered with water that supports many types of plants. • They can be saturated or flooded and include areas known as marshes, bogs, and swamps. • They are home tomany differenttypes of organisms,from herbivoresto crustaceans. • Unfortunately,humans havedestroyed them,but many are nowprotected inmany places. Fig. 50.21a
Estuaries are areas where freshwater and salt water meet. • The salinity of these areas can vary greatly. • They are crucial feeding areas for many types of water fowl.
Zonation in Marine communities. • The intertidal zone is where the land meets the water. • The neritic zone includes the shallow regions over the continental shelves. • The oceanic zone extends past the continental shelves, and can be very deep. • The pelagic zone is the open water. • The benthic zone is the seafloor.
Coral reefs exist in the neritic zone. • They constitute aconspicuous anddistinctive biome. • They are dominatedby coral and includea very diverseassortment ofvertebrates andinvertebrates.
E.The geographic distribution of terrestrial biomes is based mainly on regional variations in climate
Vertical stratification is also important in these biomes. • The canopy of the tropical rain forest is the top layer, covering the layers below. • The permafrost in the tundra is a permanently frozen stratum that lies under ground. • Human activity has radically altered the natural patterns of many biomes.
Tropical forests are close to the equator, receive high amounts of rainfall (although this can vary from region to region), and contain a great variety of plants and animals. • The vegetation is layered, with the canopy being one of the top layers.
Savannas are grasslands with scattered trees, that show distinct seasons, particularly wet and dry. Fire is an important abiotic factor.
Deserts have low rainfall, and are generally hot. • Vegetation is usually sparse, and includes cacti and succulents. • Many animalsare nocturnal,so they canavoid the heat. Fig. 50.25c
Chaparrals have mild wet winters and dry hot summers. • They containdense spiny,evergreenshrubs andhave periodicfires. • Some plantsproduce seedsthat will onlygerminateafter a fire. Fig. 50.25d
Temperate grasslands exhibit seasonal drought, occasional fires, and are usually used for grazing and agriculture.
Temperate deciduous forests contain dense stands of trees and have very cold winters and hot summers. • The trees loseleaves and godormant in winter. • This biomeincludes a largevariety of plantsand animals. • Humans havelogged many ofthese forestsaround the world. Fig. 50.25f
Coniferous forests (taigas) are the largest terrestrial biome on earth. • They exhibit long cold winters and short wet summers.
Tundra contains low growing plants. • The climate is windy and cold which causes a short growing season. • A layer of permafrost is found below 1 meter and does not thaw, which prevents root growth; not many animals live in tundra biomes. • There are two types, arctic, which is found in areas of Alaska and the Arctic circle, and alpine, which is found on very high mountaintops.
F. Population ecology • Populations have size and geographical boundaries. • The density of a population is measured as the number of individuals per unit area. • The dispersion of a population is the pattern of spacing among individuals within the geographic boundaries.
Measuring density of populations is a difficult task. • We can count individuals; we can estimate population numbers.
One sampling technique that researchers use is known as the mark-recapture method. • Individuals are trapped in an area and captured, marked with a tag, recorded, and then released. • After a period of time has elapsed, traps are set again, and individuals are captured and identified. • This information allows estimates of population changes to be made.
Patterns of dispersion vary… Clumped xxx xxx This dispersion pattern is mostly due to resource distribution. Uniform x x x x x x This dispersion pattern is due to direct interactions between individuals such as competition for resources. Random xx x xxx x xxxx This pattern is due to the absence of interactions within a population.
Clumped dispersion is when individuals aggregate in patches.
By contrast, uniform dispersion is when individuals are evenly spaced.
In random dispersion, the position of each individual is independent of the others.
G. Demography is the study of factors that affect the growth and decline of populations • Additions occur through birth, and subtractions occur through death. • Demography studies the vital statistics that affect population size. • Life tables and survivorship curves. • A life table is an age-specific summary of the survival pattern of a population.
A graphic way of representing the data is a survivorship curve. • This is a plot of the number of individuals in a cohort still alive at each age. • A Type I curve shows a low death rate early in life (humans). • The Type II curve shows constant mortality (squirrels). • Type III curve shows a high death rate early in life (oysters).
Reproductive rates. • Demographers that study populations usually ignore males, and focus on females because only females give birth to offspring. • A reproductive table is an age-specific summary of the reproductive rates in a population. • For sexual species, the table tallies the number of female offspring produced by each age group.
H. Population Growth • To understand how much a population’s growth may be changing, birth and death rates must be considered.
Using mathematical notation we can express this relationship as follows: • If N represents population size, and t represents time, then N is the change is population size and t represents the change in time, then: • N/t = B-D • Where B is the number of births and D is the number of deaths
If B = D then there is zero population growth • Under ideal conditions, a population grows rapidly. • Exponential population growth is said to be happening • Under these conditions, we may assume the maximum growth rate for the population (rmax) to give us the following exponential growth • dN/dt = rmaxN
I. The logistic model of population growth incorporates the concept of carrying capacity • Typically, unlimited resources are rare. • Population growth is therefore regulated by carrying capacity (K), which is the maximum stable population size a particular environment can support.
The logistic growth equation • We can modify our model of population growth to incorporate changes in growth rate as population size reaches a carrying capacity. • The logistic population growth model incorporates the effect of population density on the rate of increase.