Download
1 / 58
580 likes | 601 Vues
This report provides information on the average published charges, estimated budgets, and distribution of tuition and fees for full-time undergraduate students in the 2012-13 academic year. It also includes data on inflation-adjusted prices over the years and regional variations in tuition and fees.

E N D
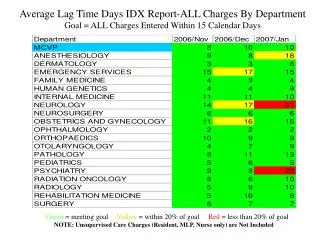
Average Published Charges for Full-Time Undergraduates by Sector, 2012-13 (Enrollment-Weighted) —Sample too small to provide meaning information. SOURCE: The College Board, Trends in College Pricing 2012, Table 1A.
Average Published Charges for Full-Time Undergraduates by Carnegie Classification, 2012-13 (Enrollment-Weighted) SOURCE: The College Board, Trends in College Pricing 2012, Table 1B.
Average Estimated Full-Time Undergraduate Budgets, 2012-13 (Enrollment-Weighted) SOURCE: The College Board, Trends in College Pricing 2012, Figure 1.
Distribution of Full-Time Undergraduates at Four-Year Institutions by Published Tuition and Fees, 2012-13 SOURCE: The College Board, Trends in College Pricing 2012, Figure 2.
Distribution of Full-Time Undergraduates at Public and Private Nonprofit Four-Year Institutions by Percentage and Dollar Increase in Published Tuition and Fees, 2012-13 SOURCE: The College Board, Trends in College Pricing 2012, Figure 3.
Average Annual Percentage Increases in Inflation-Adjusted Published Prices by Decade, 1982-83 to 2012-13 SOURCE: The College Board, Trends in College Pricing 2012, Figure 4.
Inflation-Adjusted Published Tuition and Fees Relative to 1982‑83, 1982‑83 to 2012‑13 (1982‑83 = 100) SOURCE: The College Board, Trends in College Pricing 2012, Figure 5.
Average Tuition and Fee and Room and Board Charges in 2012 Dollars, 1972-73 to 2012-13, Selected Years SOURCE: The College Board, Trends in College Pricing 2012, Table 2A.
Average Tuition and Fee and Room and Board Charges in 2012 Dollars, 2002-03 to 2012-13 SOURCE: The College Board, Trends in College Pricing 2012, Table 2B.
Public Two-Year Institutions: Average Tuition and Fee and Room and Board Charges by College Board Region, in 2012 Dollars, 2002‑03 and 2012‑13 (Enrollment-Weighted) SOURCE: The College Board, Trends in College Pricing 2012, Figure 6.
Public Four-Year Institutions: Average Tuition and Fee and Room and Board Charges by College Board Region, in 2012 Dollars, 2002‑03 and 2012‑13 (Enrollment-Weighted) SOURCE: The College Board, Trends in College Pricing 2012, Figure 6.
Private Nonprofit Four-Year Institutions: Average Tuition and Fee and Room and Board Charges by College Board Region, in 2012 Dollars, 2002‑03 and 2012‑13 (Enrollment-Weighted) SOURCE: The College Board, Trends in College Pricing 2012, Figure 6.
Average In-State Tuition and Fees at Public Four-Year and Two-Year Institutions, by State, 2012-13 and 5-Year Percentage Change in Inflation-Adjusted Tuition and Fees, 2007-08 to 2012-13 SOURCE: The College Board, Trends in College Pricing 2012, Figure 7.
In-State Tuition and Fees at Flagship Universities, by State, 2012-13 and 5-Year Percentage Change in Inflation-Adjusted Tuition and Fees, 2007-08 to 2012-13 SOURCE: The College Board, Trends in College Pricing 2012, Figure 8.
Published Tuition and Fees, Net Tuition and Fees, and Room and Board in 2012 Dollars, Full-Time Undergraduate Students at Public Institutions, 1992-93, 1997-98, 2002-03, 2007-08, and 2012-13 (Estimated) SOURCE: The College Board, Trends in College Pricing 2012, Figure 9.
Published Tuition and Fees, Net Tuition and Fees, and Room and Board in 2012 Dollars, Full-Time Undergraduate Students at Public Institutions, 1992-93, 1997-98, 2002-03, 2007-08, and 2012-13 (Estimated) SOURCE: The College Board, Trends in College Pricing 2012, Figure 9 table.
Published Tuition and Fees, Net Tuition and Fees, and Room and Board in 2012 Dollars, Full-Time Undergraduate Students at Private Nonprofit Four-Year Institutions, 1992‑93, 1997‑98, 2002‑03, 2007‑08, and 2012‑13 (Estimated) SOURCE: The College Board, Trends in College Pricing 2012, Figure 10.
Published Tuition and Fees, Net Tuition and Fees, and Room and Board in 2012 Dollars, Full-Time Undergraduate Students at Private Nonprofit Four-Year Institutions, 1992‑93, 1997‑98, 2002‑03, 2007‑08, and 2012‑13 (Estimated) SOURCE: The College Board, Trends in College Pricing 2012, Figure 10 table.
Sources of Gross Tuition Revenue per Full-Time Equivalent (FTE) Student at Public Institutions by Carnegie Sector: Payments Directly from Students, Federal and State Grants, and Institutional Grants, 1999-2000, 2004-05, and 2009-10 SOURCE: The College Board, Trends in College Pricing 2012, Figure 11A.
Sources of Gross Tuition Revenue per Full-Time Equivalent (FTE) Student at Private Nonprofit Institutions by Carnegie Sector: Payments Directly from Students, Federal and State Grants, and Institutional Grants, 1999‑2000, 2004‑05, and 2009‑10 SOURCE: The College Board, Trends in College Pricing 2012, Figure 11B.
Annual Percentage Change in State Appropriations for Higher Education per Full-Time Equivalent (FTE) Student and Percentage Change in Inflation-Adjusted Tuition and Fees at Public Four-Year Institutions, 1981-82 to 2011-12 SOURCE: The College Board, Trends in College Pricing 2012, Figure 12A.
State Appropriations for Higher Education: Total Appropriations in 2011 Dollars (in Billions), Appropriations per Public FTE Student in 2011 Dollars, and Public FTE Enrollment (in Millions), 1981-82 to 2011-12 SOURCE: The College Board, Trends in College Pricing 2012, Figure 12B.
Average State Appropriations for Higher Education per $1,000 in Personal Income, 1989-90 to 2011-12 SOURCE: The College Board, Trends in College Pricing 2012, Figure 13A.
State Appropriations for Higher Education per $1,000 in Personal Income, 2011-12 and 5-Year Change from 2006-07 to 2011-12 SOURCE: The College Board, Trends in College Pricing 2012, Figure 13B.
Institutional Revenues per FTE Student in 2010 Dollars at Public Institutions, by Revenue Source, 1999‑2000 to 2009‑10, Selected Years SOURCE: The College Board, Trends in College Pricing 2012, Figure 14A.
Institutional Revenues per FTE Student in 2010 Dollars at Private Nonprofit Institutions, by Revenue Source, 1999‑2000 to 2009‑10, Selected Years SOURCE: The College Board, Trends in College Pricing 2012, Figure 14B.
Aggregate Total Revenue from Private Gifts, Investment Returns, and Endowment Income as a Percentage of Aggregate Revenue from Other Sources, 1999-2000 to 2009‑10 SOURCE: The College Board, Trends in College Pricing 2012, Figure 14C.
Net Tuition Revenues, Subsidies, and Education and Related Expenditures per Full-Time Equivalent (FTE) Student in 2010 Dollars at Public Institutions (and Percentage of Expenditures Covered by Net Tuition), 1999‑2000, 2004‑05, and 2009‑10 SOURCE: The College Board, Trends in College Pricing 2012, Figure 15A.
Net Tuition Revenues, Subsidies, and Education and Related Expenditures per Full-Time Equivalent (FTE) Student in 2010 Dollars at Private Nonprofit Institutions (and Percentage of Expenditures Covered by Net Tuition), 1999‑2000, 2004‑05, and 2009‑10 SOURCE: The College Board, Trends in College Pricing 2012, Figure 15B.
Endowment Assets per Full-Time Equivalent (FTE) Student at Private Nonprofit Four-Year Colleges and Universities by Decile and Carnegie Classification, 2010-11 SOURCE: The College Board, Trends in College Pricing 2012, Figure 16.
Endowment Assets per Full-Time Equivalent (FTE) Student at Public Four-Year Colleges and Universities by Decile and Carnegie Classification, 2010-11 SOURCE: The College Board, Trends in College Pricing 2012, Figure 16.
Inflation-Adjusted Endowment Assets at Private Nonprofit Four-Year Colleges and Universities Relative to 1999‑2000, 1999‑2000 to 2010‑11 SOURCE: The College Board, Trends in College Pricing 2012, Figure 17A.
Average Reported Spending Rates for College and University Endowments and Affiliated Foundations, 2001‑02 to 2010‑11, Selected Years SOURCE: The College Board, Trends in College Pricing 2012, Figure 17B.
Percentage Change in Inflation-Adjusted Mean Family Income by Quintile, 1981–1991, 1991–2001, and 2001–2011 SOURCE: The College Board, Trends in College Pricing 2012, Figure 18A.
Percentage Change in Inflation-Adjusted Mean Family Income by Quintile, 1981–1991, 1991–2001, and 2001–2011 SOURCE: The College Board, Trends in College Pricing 2012, Figure 18A table.
Median Family Income by Selected Characteristics, 2011 SOURCE: The College Board, Trends in College Pricing 2012, Figure 18B.
Distribution of Students at Public Institutions by Attendance Status and Level of Enrollment, Fall 1990 Through Fall 2010, Selected Years SOURCE: The College Board, Trends in College Pricing 2012, Figure 19.
Distribution of Students at Private Institutions by Attendance Status and Level of Enrollment, Fall 1990 Through Fall 2010, Selected Years SOURCE: The College Board, Trends in College Pricing 2012, Figure 19.
Distribution of Degrees Granted by Type of Degree and Sector, 1999‑2000, 2004‑05, and 2009‑10 SOURCE: The College Board, Trends in College Pricing 2012, Figure 20.
Percentage Distribution of Enrollment of Full-Time Undergraduates and All Undergraduates in Degree-Granting Institutions by Sector, Fall 2010 SOURCE: The College Board, Trends in College Pricing 2012, Figure 21.
Percentage of Undergraduate Students Enrolled Part-Time in Fall 2010, by Sector SOURCE: The College Board, Trends in College Pricing 2012, Figure 21 table.
Full-Time Equivalent (FTE) Enrollment in Public Degree-Granting Institutions by State, Fall 2010 SOURCE: The College Board, Trends in College Pricing 2012, Figure 22A.
Percentage of All Public Full-Time Equivalent (FTE) Enrollment in Two-Year Colleges, by State, Fall 2010 SOURCE: The College Board, Trends in College Pricing 2012, Figure 22B.
Percentage Increases in Total Full-Time Equivalent (FTE) Enrollment in Public Degree‑Granting Institutions Between Fall 2000 and Fall 2010, by State SOURCE: The College Board, Trends in College Pricing 2012, Figure 23.
Percentage of First-Time First-Year Students in U.S. Degree-Granting Institutions Who Were from the State Where They Enrolled, Fall 2000 to Fall 2010 SOURCE: The College Board, Trends in College Pricing 2012, Figure 24A.
Percentage of First-Time First-Year Students in Degree-Granting Institutions Who Were from the State Where They Enrolled, by State, Fall 2010 SOURCE: The College Board, Trends in College Pricing 2012, Figure 24B.
Percentage Distribution of Full-Time Equivalent (FTE) Undergraduate Enrollment at Four-Year Degree-Granting Institutions by Acceptance Rate, Fall 2010 Percentage Distribution of Four-Year Degree-Granting Undergraduate Institutions by Acceptance Rate, Fall 2010 SOURCE: The College Board, Trends in College Pricing 2012, Figure 25A and Figure 25B.
Overall 6-Year Graduation Rate (by Fall 2010) of 2004 Cohort at Four-Year Institutions by Acceptance Rate of Institution SOURCE: The College Board, Trends in College Pricing 2012, Figure 25C.
Number of Full-Time Equivalent (FTE) Staff per 100 FTE Students in Degree-Granting Institutions (with Instructional Staff as a Percentage of Total Staff), Fall 1976, Fall 1999, Fall 2009, and Fall 2011 SOURCE: The College Board, Trends in College Pricing 2012, Figure 26A.