Guided Steps for Project Setup and Data Import in Software X
70 likes | 175 Vues
Learn how to set up your project, import data, create parameter sets, and analyze results in Software X for genetic clustering analysis. Understand the data structure, interpret key results, and visualize genetic clusters effectively.

Guided Steps for Project Setup and Data Import in Software X
E N D
Presentation Transcript
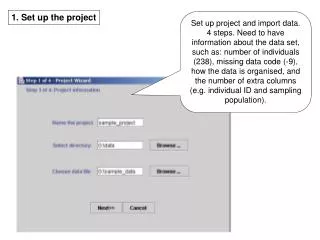
1. Set up the project Set up project and import data. 4 steps. Need to have information about the data set, such as: number of individuals (238), missing data code (-9), how the data is organised, and the number of extra columns (e.g. individual ID and sampling population).
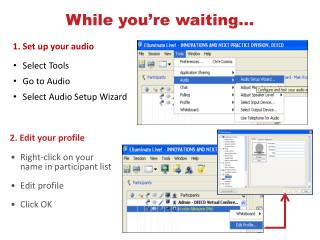
Check the menus. In “parameter set” you create new parameter sets 2. Check data Check the imported data.
Go to these submenus to select various options for your run. Start by using default settings. 3. Create a new parameter set “Burnin Periods”: the number of iterations that will not be used to calculate the results “Number of MCMC”: these iterations will be used to calculate the results
Select “project” and “start a job” 4. Start a job Choose your Parameter Set Set K:s and number of iterations
Results from different runs 5. The result “Bar plot” option “Estimated Ln Prob of Data” and other aspects of your run are found here. Scroll down to view (see next page).
6. Result: text window The estimated likelihood for the run. Used to evaluate the number of K:s. Estimated Ln Prob of Data = -2758.4 Mean value of ln likelihood = -2625.9 Variance of ln likelihood = 265.0 Mean value of alpha = 4.2431 Mean value of Fst_1 = 0.4914 Mean value of Fst_2 = 0.3791 Mean value of Fst_3 = 0.0022 Inferred ancestry of individuals: Label (%Miss) Pop: Inferred clusters 1 1 (0) 1 : 0.342 0.329 0.328 2 2 (0) 1 : 0.347 0.340 0.313 3 3 (0) 1 : 0.352 0.333 0.315 4 4 (0) 1 : 0.379 0.343 0.278 5 5 (0) 1 : 0.325 0.340 0.335 Fst for the different clusters to the full data set The admixture proportion of each individual to the different clusters
7. Result: Bar graph For example, this individual (from locality 2) has an Admixture proportion of ca 50% to the red cluster, ca 47% to the blue and ca 3% to the green. A summary graph showing the Admixture proportion (or membership fraction) of each individual. The sampled populations (1-4) correspond well to three genetic clusters, i.e. there is genetic structure.