Download
1 / 37
370 likes | 524 Vues
IMPACT OF HIGH FOOD PRICES ON PRODUCERS AND REQUIRED INTERVENTIONS. John Purchase Agricultural Business Chamber (ABC) Gauteng Food Summit 10 & 11 July 2008. Introduction Causes of high food prices South African situation Competitiveness, Profitability and Confidence of Industry

E N D
IMPACT OF HIGH FOOD PRICES ON PRODUCERS AND REQUIRED INTERVENTIONS John Purchase Agricultural Business Chamber (ABC) Gauteng Food Summit 10 & 11 July 2008
Introduction Causes of high food prices South African situation Competitiveness, Profitability and Confidence of Industry Investment situation and climate Interventions Conclusion
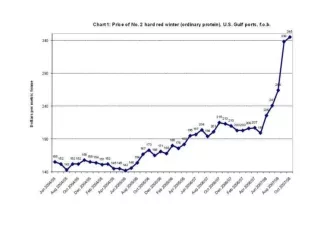
Causes of high food prices High agricultural commodity prices Global macro-economic factors - Strong economic growth, stimulating demand - Depreciation of the US dollar - Increased speculative transactions in markets Dynamics of the specific agricultural commodities Changes in government policies
500 450 400 350 300 250 200 150 100 50 0 1990 1991 1992 1993 1994 1995 1996 1997 1998 1999 2000 2001 2002 2003 2004 2005 2006 2007 2008 Oil Food Metals All Commodities Rising Commodity Prices(January 1990 = 100)
7000 6000 5000 Rand per ton 4000 3000 2000 1000 Feb Apr Jun Aug Okt Dec Feb Apr Jun Aug Okt Des Feb 2006 2007 2008 Ammonium DAP Potasium Urea International fertilizer prices
12 10 8 6 4 2 0 Developed World Developing China India USA 1975-90 2009-17 1990-2000 2000-07 Mean Real GDP Growth (%)
70 350 60 300 Million tons $/ton FOB 50 250 40 200 30 150 100 20 10 50 0 0 87/88 91/92 95/96 99/00 03/04 07/08 End Stocks U.S. HRW Price End stocks and the Price of Wheat the past 10 years
350 300 250 200 150 100 50 0 1995 1996 1997 1998 1999 2000 2001 2002 2003 2004 2005 2006 2007 Exports Maize for ethanol Maize Production USA Maize production, exports and ethanol use (MMT)
250 200 150 100 50 0 97/98 98/99 99/00 00/01 01/02 02/03 03/04 04/05 05/06 06/07 07/08 Production Consumption End stocks Soya production, consumption and end stocks (MMT)
180 160 140 Million ton 120 100 80 60 40 20 0 1995 1996 1997 1998 1999 2000 2001 2002 2003 2004 2005 2006 2007 Vegetable oil imports by China (MMT)
South African situation Declining maize production area But significant maize yield increases (productivity increases) Maize Crop of ~12,0 MMT has helped to stabilize prices – need Extensive wheat and soya meal imports still a major concern
Maize area planted in South Africa 1923/24 to 2006/07 Million hectares PRODUCTION YEARS
Mean yield of maize:1923/24 to 2006/07 Ton/ha PRODUCTION YEARS
Competitiveness, Profitability and Confidence of industry • Increased competitiveness: Requires policies for adoption of quality and productivity improvements in order to exploit export potential, but also to maintain and grow local markets
2.50 2.00 1.50 1.00 0.50 - 1979 1969 1975 2001 2005 1961 1963 1965 1967 1971 1973 1977 1981 1983 1985 1987 1989 1991 1993 1995 1997 1999 2003 2007 (0.50) Competitiveness : 1960 - 2007
Investment situation and climate Gross fixed capital formation has remained stagnant Capital stock in Agriculture has declined over the past decade, but showing signs of a turnaround due to improved profitability.
9000 8000 7000 6000 5000 4000 3000 2000 1000 0 1994 1995 1996 1997 1998 1999 2000 2001 2002 2003 2004 2005 2006 Constant 2000 prices Current prices Gross fixed capital formation: Agriculture, forestry and fishing: 1994-2006 R million
82000 81000 80000 79000 R Million 78000 77000 76000 75000 74000 1996 1997 1998 1999 2000 2001 2002 2003 2004 2005 2006 2007 Year Capital Stock in Agriculture (Constant 2000 prices): 1995 - 2007
Constraints and Challenges to Investment in Agribusiness • Limited global competitiveness and profitability (High input costs, especially derived from energy costs!) • Skewed participation and access • Not sufficiently adequate support and delivery systems • Often poor and unsustainable management of natural resources • Governance and entrepreneurship – public and private • Knowledge and innovation for productivity/new products • International cooperation, e.g. trade agreements, etc. • Infrastructure • Safety and security • Traditionally, low investor confidence, but changing
2.50 2.00 1.50 1.00 0.50 - 1979 1969 1975 2001 2005 1961 1963 1965 1967 1971 1973 1977 1981 1983 1985 1987 1989 1991 1993 1995 1997 1999 2003 2007 (0.50) Trends in Agribusiness Confidence : 2001 - 2007
Short Term Interventions Agree wholeheartedly that Government needs to support the vulnerable and poorest of the poor, e.g. food stamps, starter packs, feeding schemes, etc.
Medium and long term interventions Government to create an enabling (market) policy environment for entrepreneurs to exploit opportunity Investment in general infrastructure in rural areas, but also in agricultural infrastructure Technology development and transfer needs to be improved through investment and bringing top students into this environment
Medium and long term interventions • Major investment in skills development • Improve access to capital and facilitate financing of agricultural production • Establish improved information systems, with improved communication • Ensure sustainable resource management • Improved institutional support services by both public and private sector
Conclusion • Food price crisis is a global phenomenon and complex • Holds many threats to society, especially to the poorest of the poor and most vulnerable of society • Opportunities are however certainly increasing across whole industry
Conclusion Global economy changing rapidly Global food and agriculture changing rapidly Food crisis will challenge conventional thinking across whole value chains Sustainability: Less intensive energy systems with Conservation Agriculture
Conclusion Create confidence, competitiveness and profitability in the sector!