Download
1 / 10
100 likes | 122 Vues
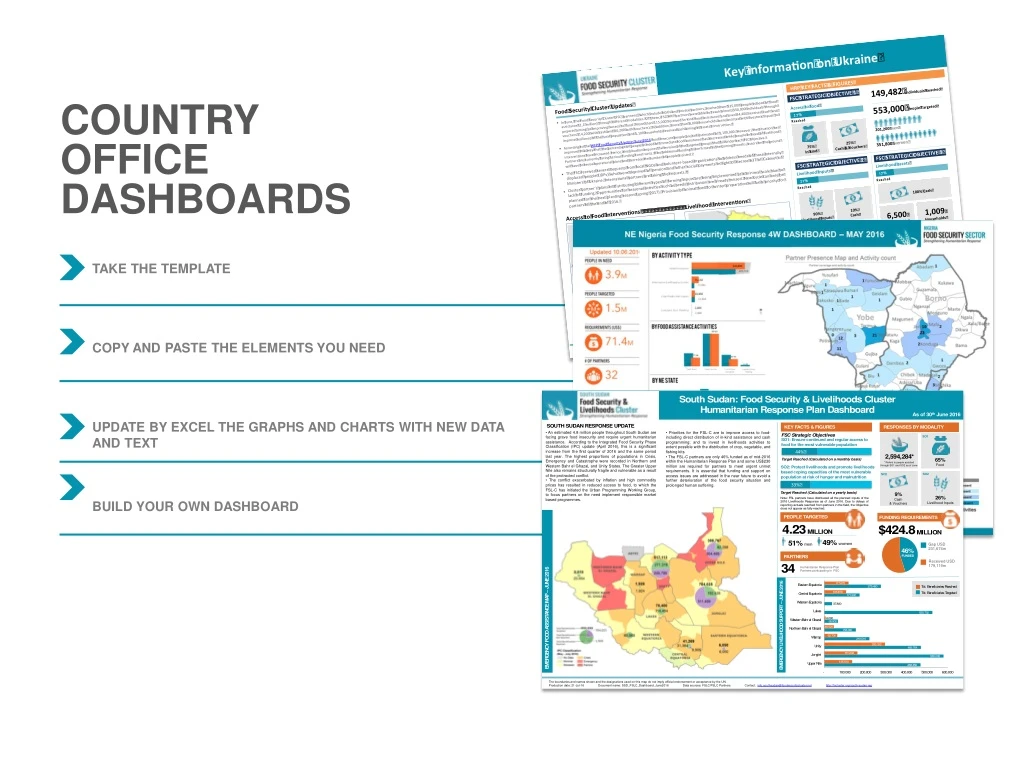
COUNTRY OFFICE DASHBOARDS. TAKE THE TEMPLATE Copy and paste the elements you need Update by excel the graphs and charts with new data and text Build your own dashboard. Country Title Food Security Cluster Dashboard. As of (Date). KEY FACTS & FIGURES. RESPONSES. COUNTRY RESPONSE UPDATE.

E N D
COUNTRY OFFICE DASHBOARDS TAKE THE TEMPLATE Copy and paste the elements you need Update by excel the graphs and charts with new data and text Build your own dashboard
Country Title Food Security Cluster Dashboard As of (Date) KEY FACTS & FIGURES RESPONSES COUNTRY RESPONSE UPDATE KEY FACTS & FIGURES Add content or bullet points "Loremipsum dolor sit amet, consecteturadipiscingelit, sed do eiusmodtemporincididuntutlabore et dolore magna aliqua. Utenim ad minim veniam, quisnostrud exercitation ullamcolaboris nisi utaliquip ex eacommodoconsequat. Duisauteirure dolor in reprehenderit in voluptatevelitessecillumdoloreeufugiatnullapariatur. Excepteursintoccaecatcupidatat non proident, sunt in culpa qui officiadeseruntmollitanim id estlaborum. "Loremipsum dolor sit amet, consecteturadipiscingelit, sed do eiusmodtemporincididuntutlabore et dolore magna aliqua. Utenim ad minim veniam, quisnostrud exercitation ullamcolaboris nisi utaliquip ex eacommodoconsequat. Duisauteirure dolor in reprehenderit in voluptatevelitessecillumdoloreeufugiatnullapariatur. Excepteursintoccaecatcupidatat non proident, sunt in culpa qui officiadeseruntmollitanim id estlaborum. FSC Strategic Objectives SO1 SO1: Ensure continued and regular access to food for the most vulnerable population Target Reached (Calculated on a monthly basis) 2,594,284* 65% Food SO2: Protect livelihoods and promote livelihoods based coping capacities of the most vulnerable population at risk of hunger and malnutrition * Refers to people assisted through SO1 and SO2 as of June SO2 SO2 Target Reached (Calculated on a yearly basis) Note: FSL partners have distributed all the planned inputs of the 2016 Livelihoods Response as of June 2016. Due to delays of reporting actuals reached from partners in the field, the Objective does not appear as fully reached. 9% Cash & Vouchers 26% Livelihood Inputs MAP from GIS “.jpeg” or “.png” $424.8 PEOPLE TARGETED FUNDING REQUIRED 4.23 MILLION MILLION 49% women 51% men Graphs/Text or Other COUNTRY RESPONSE PLAN MAP GRAPHS TITLE Contact:(your.name)@foodsecuritycluster.nethttp://fscluster.org/ Production date: XX-Aug-16 Data sources: FSLC/FSLC Partners The boundaries and names shown and the designations used on this map do not imply official endorsement or acceptance by the UN. http://fscluster.org/xxxx
LABELS KEY FACTS & FIGURES PEOPLE TARGETED FUNDING REQUIRED TOTAL FUNDING FOOD INSECURE PEOPLE PARTNERS PEOPLE REACHED RESPONSES BY MODALITY Add Icon where possible PEOPLE TARGETED PARTNERS PEOPLE REACHED FUNDING REQUIRED Choose your required icon Funding People Targeted People Reached Partners Food Food Insecurity Food Assisted Livelihoods Cash Voucher
MODALITIES SO1 SO2 SO2 SO1 2,594,284* 65% Food * Refers to people assisted through SO1 and SO2 as of June SO2 SO2 2,594,284* 9% Cash & Vouchers 65% Food 26% Livelihood Inputs * Refers to people assisted through SO1 and SO2 as of June 9% Cash & Vouchers 26% Livelihood Inputs Choose your required icon Funding People Targeted People Reached Partners Food Food Insecurity Food Assisted Livelihoods Cash Voucher
FUNDING REQUIREMENTS FUNDING $77.8m Total Requirements $48.8m (63%) Funding Requirements: $29m Resourced FUNDING STATUS FUNDING STATUS 51% 51% 51% Received: $7.8m Total Requirements: $15.1m Received: $7.8m Total Requirements: $15.1m Received: $7.8m Total Requirements: $15.1m 60% 60% 60% Received: $26.9m Total Requirements: $43.1m
FUNDING ICONS 100% 90% 80% 70% 60% 50% 40% 30% 20% 10% 0% Copy and paste your bag
GRAPHS Gap USD 231,674m 46% FUNDED 64% Received USD 179,119m 14% 4% 0% Received: $172.6m Received: $5.6m Received: $0m Gap USD 231,674m Requirements: $847.1m Requirements: $39m Requirements: $1.8m 46% 64% Received USD 179,119m GENERAL GRAPHS / INFO men women BY GENDER BY CATEGORY 52% Men/Boys 81% Target Reached 44% Target Reached 48% Women/Girls 19% Target Reached 33% Target Reached
COLORS R 5 G 148 B 175 R 23 G 55 B 94 R 225 G 104 B 29 R 89 G 89 B 89 FONT Arial bold italic bold italic
MAP BUBBLES 1.5 Million Food Insecure 14.4 million Food Insecure 4.8 million Severely Food Insecure (May-July 2016) 272,261 million 272,261 million 272,261 million 1.61 million 7.6 million Severely Food Insecure 137,337 mil 137,337 mil 137,337 mil 137,337 mil 114,048 mil 114,048 mi 114,048 mi 114,048 mil 272,261 million Bubbles background color always with 87% transparency
Make sure to always update date of Map. Keep Country Logo always at the top left corner. Take logo from the FSC website Intro text, giving overall overview always go first Take WFP icons from the FSC webiste Keep the design simple and eye catching. Don’t use too many colours. Remember: design should help comprehension. An effective infographic should be a good balance of visual and written information. Choose the best box format and graph according to your space Keep the chart as big as possible and don’t overlay it with too many colors or bubbles. TIPS FOR CREATING YOUR OWN DASHBOARD Please be aware that bubbles don’t cover essential data on the map If you need to add a color for a new graph, dark blue shades are a good solution Keep the footer of the page always the same height and make sure all info is updated including: contact name, country office, website, document name and any other relevant info.