Understanding Weather and Climate: A Guide to Cloud Types and Environmental Impact
This guide explores the relationship between weather and climate, emphasizing the importance of long-term climatic patterns and their effects on local ecosystems. It details various types of clouds, such as stratus, nimbostratus, altocumulus, and cirrus, highlighting their characteristics and weather implications. The document also presents tourism insights about Queenstown, New Zealand, showing the influence of seasonal changes on activities and the local economy. Readers will learn the differences between short-term weather and long-term climate impacts on vegetation and wildlife.

Understanding Weather and Climate: A Guide to Cloud Types and Environmental Impact
E N D
Presentation Transcript
Weather With You Research 1.5 4 credits To go with Geostuff Resources
Weather Terms • Complete the mix and match activity
Weather and Climate • Climate is the average weather over a long time period (30 years) for a particular region. The climate affects a number of environmental factors within the region including the type and growth of vegetation and wildlife. • Weather describes the short-term state of our atmosphere. This may include information about the air temperature, precipitation, air pressure and cloud cover. Our local weather changes daily due to the movement of air in our atmosphere. The Earth rotating around the sun causes seasonal changes giving us hotter summers and cooler winters.
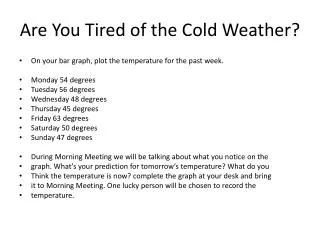
Tourism in Queenstown New Zealand • Using the data below construct a climate graph for Queenstown.
Read the 10 sentences below. Place the sentence letter on the climate graph drawn in Task 1, in the place it is mostly likely to occur. • Most accommodation is booked • People expect long queues at the ski lifts • The local emergency Department is dealing with large numbers of broken limbs • Ski Season is coming to an end • Ski instructors are hired • Local Council and DOC assess the environmental damage on ski slopes • Adventure tourism activities (rafting, bungee, etc) increase with more favourable weather conditions • Bookings of the TSS Earnslaw on Lake Wakatipu are at yearly high • Cafes move tables outside so customers can begin to enjoy alfresco eating • The Remarkables are beginning explored by trampers
From New Zealand’s Thermal Wonderland to the Mediterranean! • Task • Imagine a young adult, aged 22, who lives in Rotorua, New Zealand, is going on his OE. His first destination is Marseille in the South of France. You have been asked to give him a factual and accurate account of how the climates are different. It is important that you use a comparative style to write this account.
TYPES OF CLOUDS LOW CLOUDS: STRATUS CLOUDS • Stratus clouds are uniform grayish clouds that often cover the entire sky. They resemble fog that does not reach the ground. Usually no precipitation falls from stratus clouds, but sometimes they may drizzle. • Nimbostratus clouds form a dark gray, "wet" looking cloudy layer associated with continuously falling light to moderate rain or snow.
MIDDLE CLOUDS: ALTO CLOUDS • Clouds with the prefix "alto" are middle level clouds that have bases between 2000 and 7000 m (6500 to 23,000 ft.). • Altocumulus clouds are middle level clouds that are made of water droplets and appear as gray, puffy masses, sometimes rolled out in parallel waves or bands. The appearance of these clouds on a warm, humid summer morning often means thunderstorms may occur by late afternoon. • Altostratus clouds are gray or blue-gray middle level clouds composed of ice crystals and water droplets. These clouds usually cover the entire sky. In the thinner areas of the cloud, the sun may be dimly visible as a round disk. Altostratus clouds often form ahead of storms that will produce continuous precipitation.
HIGH CLOUDS: CIRRUS CLOUDS • Cirrus clouds are thin, wispy clouds blown by high winds into long streamers. They are considered "high clouds" forming above 6000 m (20,000 ft). Cirrus clouds usually move across the sky from west to east. They generally mean fair to pleasant weather. • Cirrostratus clouds are thin, sheet like high clouds that often cover the entire sky. They are so thin that the sun and moon can be seen through them. • Cirrocumulus clouds appear as small, rounded white puffs. The small ripples in the cirrocumulus sometimes resemble the scales of a fish. A sky with cirrocumulus clouds is sometimes referred to as a "mackerel sky."
CLOUDS WITH VERTICAL DEVELOPMENT: CUMULUS CLOUDS Cumulus clouds are puffy clouds that sometimes look like pieces of floating cotton. The base of each cloud is often flat and may be only 1000 m (330 ft) above the ground. The top of the cloud has rounded towers. When the top of the cumulus resembles the head of a cauliflower, it is called towering cumulus. These clouds grow upward, and they can develop into a giant cumulonimbus, which is a thunderstorm cloud. Cumulonimbus clouds are thunderstorm clouds that form if towering cumulus clouds continue to grow vertically. Their dark bases may be no more than 300 m (1000 ft) above the Earth's surface. Their tops may extend upward to over 12,000 m (39,000 ft). Tremendous amounts of energy are released by the condensation of water vapor within a cumulonimbus. Lightning, thunder, and even violent tornadoes are associated with the cumulonimbus.
HOW MUCH OF THE SKY IS COVERED BY CLOUD? Meteorologists measure the amount of the sky covered in eighths or oktas.
Observing the Clouds • In this activity you will need to make observations about the clouds and the weather for one week. • Use the table to record the observations you make about the following cloud and weather conditions each day for one week: • Make a note of the day, date and time you made your observations • Observe how much of the sky is covered which cloud (use oktas) • What type[s] of cloud are in the sky • Describe the weather conditions • Comment on your observations. For example were certain types of clouds associated with specific weather. Did the weather and cloud type and cover change much over the week, etc?
What are fronts? • Fronts are the boundaries between air masses off different temperature, and appear on the weather maps as a line with triangles or semicircles attached.
Cold Front A cold front is the leading edge of an advancing colder air mass and is marked by a line with triangles pointing to where it is moving. It brings cloud (cumulonimbus) and precipitation (often heavy may have thunder and lightning) with strong winds. These conditions are followed by a drop in temperature and/or humidity, pressure rises and the wind changes direction. It is over quite quickly.
Warm Front The leading edge of an advancing warmer air mass and is marked by a line with semicircles pointing to where it is moving. It usually brings cloud and precipitation followed by increasing temperature and/or humidity. The pressure steadies and the wind changes direction. May last several days.
Warm Front • A warm front is defined as the transition zone where a warm air mass is replacing a cold air mass. • When a warm front passes through, the air becomes noticeably warmer and more humid than it was before. • Fronts that bring warm air are referred to as warm fronts. As this warm air approaches it is lifted upward above the cooler air. As the air in the warm air mass rises, it expands, causing it to cool down. As it cools, water vapor can condense creating precipitation.
Occluded Front An occluded front occurs when a cold front overtakes a warm front, so that all that remains of the original warm air is trapped above, where it cools making dense cloud and rain. It is marked by a line with triangles and semicircles on the same side, pointing to where the front is moving. It usually brings patchy rain with decreasing winds; pressure falls with little change to air temperature.
Stationary Front A stationary front has little movement. It is marked by a line with alternate triangles and semicircles on opposite sides, the triangles protruding into the warmer air-mass and the semicircles protruding into the cooler air-mass. It takes a while for a stationary front to pass by with rain clearing slowly and little change in temperature and pressure.
Met Service Links • A Satellite Image shows the location of the low and high pressure areas and the fronts. You can predict wind direction and strength, cloud and rain using the pressure charts. http://www.metservice.com/national/maps-rain-radar/maps/tasman-sea-nz-colour-latest
http://www.metservice.com/national/maps-rain-radar/rain-radar/rain-mahia-last-8-hrshttp://www.metservice.com/national/maps-rain-radar/rain-radar/rain-mahia-last-8-hrs Rain Information
Reading Weather Maps • What is an Air Mass? • An Air Mass is a large body of air with similar temperature and humidity characteristics throughout. The air mass gets these characteristics from spending days or weeks over the same part of the earth.
A tropical air-mass consists of warm air from the tropics • A polar air-massconsists of cold air flowing from Polar Regions • A maritime air-mass consists of moist air flowing from over a large sea area A continental air-mass consists of dry air which has come from a large land area
Complete extra weather sheets tasks • Dot to dot!
What is air pressure? Air pressure is the weight of the Earth's atmosphere pressing down on everything at the surface. How is air pressure shown on a weather map? Isobars - Contours of equal air pressure. Air pressure is measured in millibars. What can the isobars tell us about the weather? Isobars give information about the wind ie winds blow almost directly along the isobars, the closer the isobars, the stronger the winds and the further apart the more gentle the wind.
When isobars enclose an area of high pressure this is called a High or anticyclone and its centre is labelled on a weather map by an 'H'. In a high pressure air descends, there are no clouds, dry conditions, and outward moving gentle anticlockwise winds in the Southern Hemisphere (clockwise in the Northern Hemisphere). When isobars enclose an area of low pressure this is called a 'Low' or 'depression' and its centre is labelled on a weather map with an 'L'. A low pressure system is like a giant funnel of clockwise wind (in the Southern Hemisphere and anticlockwise in the Northern Hemisphere) spiraling inwards and upwards forcing warmish air in the centre to rise. As air rises it cools and clouds and rain bands form.
Weather Forecast For Over The Coming Hours For New Zealand At present there is a High Pressure system in the Tasman Sea. The system is moving in an easterly direction towards the west coast of the North and South Island. The pressure is 1030 with winds of 10 knots. As this high approaches its descending air will mean that there are no clouds, dry conditions, and outward moving gentle clockwise winds. Meanwhile approaching the South Island is a Cold Front. The air behind will be a Maritime Polar air mass. As the cold front approaches it will bring cloud (cumulonimbus) and precipitation (which will be quite heavy with possible thunder and lightning). The winds will be strong as indicated by the isobars being close together around this front. The front should pass quickly and it will be followed by a drop in temperature. The pressure will rise and the wind will change direction. This front should continue to make its way up the South Island over the next few hours.
EFFECTS OF WEATHER CONCEPT MAP • This activity examines the problems caused by heavy snow fall and uses the October 2009 snow showers on the Napier-Taupo Road as an example. • Read the information on Concept Maps. • Read the information cards. • Place the cards in a logical order on the A3 concept map template provided. • See if there are any interactions between any cards. • Once you have decided on an order stick the cards onto your A3 sheet of paper. • Draw in arrows to show how the cards interact and write words or statements to describe this interaction. • Try to come up with more information cards and add these to your concept map.
CONCEPT MAP • What do you mean when you say, I understand? • Does it mean the same thing to you as it does to another student? • How can you demonstrate your understanding? • Constructing a concept map provides a way to represent, reflect on, deepen, and share your understanding.
What is a Concept Map? • A concept map presents the relationships between information. Concept maps offer a method to represent information visually. It is a tangible way to display how your mind ‘sees’ a particular topic. In a concept map, the concepts (ideas/statements) are connected to other concept by arrows. A word or brief phrase, written by the arrow, defines the relationship between the connected concepts. Major concept boxes will have lines to and from several other concept boxes generating a network. Concept maps are a form of graphic organizer. • This is an example of a very simple Concept Map: