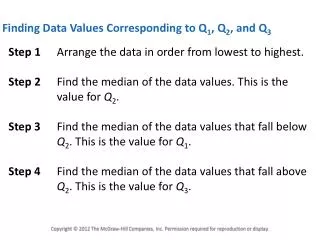
3.3. Allometric scaling laws
640 likes | 1.05k Vues
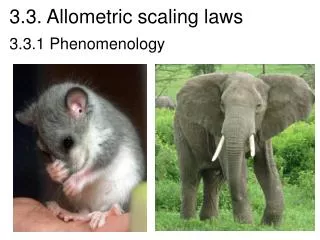
3.3. Allometric scaling laws. 3.3.1 Phenomenology. More general: how are shape and size connected?. Elephant (6000 kg). Fox (5 kg). Simple scaling argument (Gallilei). Load is proportional to weight. Weight is proportional to Volume ~ L 3.

3.3. Allometric scaling laws
E N D
Presentation Transcript
3.3. Allometric scaling laws 3.3.1 Phenomenology
More general: how are shape and size connected? Elephant (6000 kg) Fox (5 kg)
Simple scaling argument (Gallilei) Load is proportional to weight Weight is proportional to Volume ~ L3 Load is limited by yield stress and leg area; I.e. L3 ~ d2sY This implies d ~ L3/2 Or d/L ~ L1/2 ~ M1/6
Similar for the size of the stem in trees – the bigger the tree the bigger its stem
...or the lifespan as a function of weight i.e. There’s only a constant number of heart beats
But also for populations of different people to basically determine the ideal weight in terms of size...
Plot this on a double logarithmic scale and it becomes simpler – and you can see where the BMI comes from…
Metabolic rate is conveniently measured by oxygen consumption.
3.3.2. Fractals and scaling An example of a scaling argument – Flight speeds vs.mass
3 10 2 10 1 10 0 10 -5 -3 -1 1 3 5 7 9 10 10 10 10 10 10 10 10 Boeing 747 F-16 Beech Baron Cruising speed (m/s) goose sailplane starling eagle hummingbird house wren bee crane fly fruit fly dragonfly damsel fly Mass (grams) Cruise speeds at sea level
3 10 2 10 1 10 0 10 -5 -3 -1 1 3 5 7 9 10 10 10 10 10 10 10 10 Boeing 747 F-16 Beech Baron Cruising speed (m/s) goose sailplane starling eagle hummingbird house wren bee crane fly fruit fly dragonfly damsel fly Mass (grams) Cruise speeds at sea level
Consider a simple explanation L A=Area W
3 10 2 10 1 10 0 10 -5 -3 -1 1 3 5 7 9 10 10 10 10 10 10 10 10 Boeing 747 F-16 Beech Baron Cruising speed (m/s) goose sailplane starling eagle hummingbird house wren bee crane fly fruit fly dragonfly damsel fly Mass (grams) Fits pretty well!
3 10 2 10 1 10 0 10 -5 -3 -1 1 3 5 7 9 10 10 10 10 10 10 10 10 What do variations from nominalimply? Boeing 747 Short wings, maneuverable F-16 Beech Baron Cruising speed (m/s) goose sailplane starling eagle hummingbird house wren bee Long wings, soaring and gliding crane fly fruit fly dragonfly damsel fly Mass (grams)
A famous example: The energy of a nuclear explosion US government wanted to keep energy yield of nuclear blasts a secret. Pictures of nuclear blast were released in Life magazine Using Dimensional Analysis, G.I. Taylor determined energy of blast and government was upset because they thought there had been a leak of information
Radius, R, of blast depends on time since explosion, t, energy of explosion, E, and density of medium, , that explosion expands into • [R]=m, [t]=s,[E]=kg*m2/s2, =kg/m3 • R=tpEq k q=1/5, k=-1/5, p=2/5
We’re looking for a similar argument to explain the scaling of metabolic rate Metabolism works by nutrients, which are transported through pipes in a network. This forms a fractal structure, so what are fractals?
What’s special about fractals is that the “dimension” is not necessarily a whole number
Vessels in nutrient transport (veins, xyla, trachaea) actually have a brached fractal structure, so consider this for explaining metabolic rate
3.3.3. Physical model three basic assumptions • Branching, hierarchical network that is space filling to feed all cells • Capillaries are invariant of animal size • Minimization of energy to send vital resources to the terminal units (pump blood from the heart to the capillaries)
All vessels of the same level can be considered identical. Define scale-free ratios and lk is length of vessel at kth level rk is radius of vessel at kth level Allows us to relate one level to the next. The network is space-filling to reach the whole body n is branching ratio
Minimize Energy Loss through Natural Selection T R T I Dissipation (Important for small vessels, Poiseuille flow) Reflection at junctions (Important for larger vessels, pulsatile flow) Area Preserving
Metabolic Rate, B, and Body Mass, M Number of Terminal units Volume of Terminal units Blood volume Mass Met Rate Follows from Energy Min. Use scale factors to relate each level to terminal units. Invariance of terminal units B=NTBT
Other predictions from the model Invariant blood pressure Speed of flow through capillaries is invariant
One slightly couterintuitive conclusion: Each capillary feeds more cells in larger organisms tissue capillary
But in fact this is the case, cells in vivo have less consumption the bigger the animal (but constant in vitro…)
Transport happens through fractal networks even in subcellular instances – the law can be extended…
Can this help in understanding how an organism grows? Energy input Resting metabolism growth
Kleiber's rule tells us: With the stationary Solution: