Download
1 / 27
270 likes | 316 Vues
This study explores how the environment of a fluorophore can influence its fluorescence spectrum, including factors such as solvent polarity, temperature, and solvent relaxation. The experimental characterization of solvent relaxation using time-resolved emission spectra is also discussed.

E N D
Effects of fluorophore’s environment on its spectra Lenka Beranová, Martin Hof, Radek Macháň
The fluorescence spectrum S2 The fluorophore’s spectrum is determined by the spacing of its energy levels and the probabilities of transitions between them (Jablonski diagram). S1 The fluorophore’s environment influences its lifetime (transitions kinetic constants) and also its spectrum (spacing of levels) Absorption Fluorescence kf ~ 107 – 109 s-1 S0 To explain that we need to regard the fluorophore and the molecules surrounding as one quantum system and look at its energy states. Dipole-dipole interactions are the most important source of the interactions polar solvents have most pronounced effects
Fluorophore in a polar solvent The molecules of the polar solvent are oriented in such a way that their dipole moments compensate for the dipole moment of the fluorophore in order to minimize the total energy of the system fluorophore +solvation envelope S1FC solvent relaxation S1Rel Excitation Emission S0FC S0 Franck-Condon principle: redistribution of electron density caused by an electronic transition happens on a much faster scale than reorientation of nuclei Reorientation of the fluorophore’s dipole moment upon excitation leads to en energetically unfavourableFranck-Condone state from which the system relaxes through reorientation of fluorophore’s solvation envelope to a state of lower energy. Similar situation upon emission of photon from relaxed state
Fluorophore in a polar solvent The solvent relaxation introduces an additional red shift to the Stokes shift of the fluorophore spectra of fluorophores in more polar solvents tend to be shifted more to the red S1FC solvent relaxation S1Rel Excitation Emission S0FC S0 The red shift is the bigger: • the more polar the solvent is, • the bigger the dipole moment of the fluorophore is and • the bigger its change upon excitation is.
Lifetime vs. solvent relaxation The time-scale of the solvent relaxation depends on the mobility of fluorophore’s solvation envelope (local viscosity). If it is slower or comparable to the fluorescence lifetime, emission from non-relaxed state contributes largely to the spectrum. S1FC solvent relaxation S1Rel Excitation Emission S0FC S0 The lower the temperature: • the higher the local viscosity is, • the smaller the red shift of the emission spectrum is.
Lifetime vs. solvent relaxation The centre of mass of the emission spectrum is shifting to red side with advancing relaxation (molecules which have stayed longer in the excited state emit photons of higher wavelength). For a homogeneous sample a mono-exponential decay of emission spectrum centre of mass can be assumed. Assuming a mono-exponential decay of fluorescence intensity (lifetime t), we can write for the centre of mass of the steady-state spectrum: Note that the steady-state spectrum of a fluorophore, whose lifetime is sensitive to the polarity of environment, is an interplay between the effect of solvent on total red shift Dn and fluorescence lifetime t
E1 C H 3 H C N 3 C O C H 3 Fluorescence spectra of Prodan Emission spectra of prodan in different solvents: heptane water Increase of solvent polarity leads to larger red-shift
E1 C H 3 H C N 3 C O C H 3 Fluorescence spectra of Prodan Emission spectra of prodan at different temperatures: 100 K 300 K wavelength (nm) Decrease of temperature → increase of viscosity → increasing fluorescence contributions of non-relaxed states → blue-shift
S1FC solvent relaxation S1Rel Excitation Emission S0FC S0 Experimental characterization of solvent relaxation The most comprehensive information is obtained form Time Resolved Emission Spectra (TRES) 0.1 ns 10 ns Fluorescence is excited by short pulses (like in lifetime measurements), photons emitted shortly after excitation pulse come from molecules in nonrelaxed state (had not enough time to relaxed). The longer after excitation pulse, the more relaxed the molecules are. The measurement requires spectral and time resolved photon detection – can be achieved by a streak camera combined with imaging spectrograph (2-dimensional detector, one dimension arrival time, other wavelength). Most often measured indirectly
0.1 ns 10 ns Steady-state emission spectrum S0(λ) 500 nm 470 nm 440 nm 5 ns 400 nm 2 ns Time Resolved Emission Spectra (TRES) Intensity decays (TRES) D(t,λ)
Spectra of DTMAC 4-[(n-dodecylthio)methyl]-7-(N,N-dimethylamino)coumarin Time-zero estimation Measurements: 1. Emission and absorption spectra of the dye in non-polar solvent (hexan,...) 2. Absorption spectrum of the dye in the polar system of interest (liposomes,...) Data treatment: • Calculation of the so called lineshape functions f(n), g(n)from the non-polar reference spectra • Finding shift distribution p(δ) by fitting convolution of p(δ) and g(n) with polar absorption spectrum Ap(n) • Calculation of time-zero spectrum using f(n), g(n), p(δ) J. Sykora et al. Chem. Phys. Lipids (2005) 135213
TRES and description of the relaxation static (spectral shift) the change in position of the centre of mass of the spectrum is proportional to the polarity of the fluorophore’s environment fully relaxed state Frank-Condon state Dn
Dependence of spectral shift on fluorophoe’s environment polarity E2 Coumarin 153 is directly proportional to the polarity function F example: C1OH: F = 0.71; = 2370 cm-1 C5OH: F = 0.57; = 1830 cm-1 D [cm-1] F = [(s-1)/ (s+2)] - [(n2-1)/ (n2+2)] Horng et al., J Phys Chem 1995 99:17311
n ( t ) - n ( ¥ ) C ( t ) = n ( 0 ) - n ( ¥ ) TRES and description of the relaxation Kinetic (correlation function and relaxation time) Reflects local viscosity of the fluorophore’s surroundings
Kinetics of the relaxation reflect local viscosity surrounding the fluorophore E3 dyes in tetrahydrofuran 90-170 K } tP = 0.25 s Probed by phosphorescence τCT = 4 s Ru(bpy)2(CN)2 } τF = 20 ns Probed by charge-transfer emission } Probed by S1S0 fluorescence 92 K 170 K R. Richert et al. Chem. Phys. Lett. (1994) 229:302
TRES and width (FWHM) of the spectra Width (FWHM) of emission spectra changes during relaxation process. In ideal case (all fluorophores in identical environment) it would decrease monotonically to the width of the fully relaxed spectrum. In real samples a maximum is observed (differences in local environment relaxation not “in phase”). relaxation too slow compared to lifetime relaxation too fast compared to experimental time resolution Together with the time-zero estimation it can be used to estimate how much of the relaxation process is observable in the experiment. Furthermore, more complex dependence suggests fluorophore populations located in distinct environments
Red-edge excitation spectra The emission spectra are known to be independent on the excitation wavelength. However, that is not exactly so in polar environments of sufficient viscosity (tSR ≈> t) S1FC solvent relaxation S1Rel nF nR S0R* S0 In the equilibrium state, a small fraction of molecules in the ground state have solvation envelopes like excited molecules in the relaxed state. They can be excited by photons of lower energy nR (located at the red edge of the excitation spectrum)
Red-edge excitation spectra The effect of excitation wavelength depends on ration tSR /t (whether the emission spectrum is closer to n0 or n∞ ) S1FC emission spectra excited by nF or nR solvent relaxation S1Rel tSR << t nF nR n S0R* S0 tSR >> t red-edge excitation spectra can be used to estimate the characteristic timescale of solvent relaxation tSR n
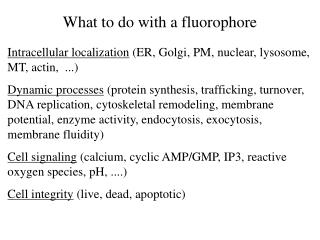
Applications of solvent relaxation Investigation oflocalpolarity and viscosityat specific sites of macromolecules and supramolecular complexes (biomembranes, proteins) A. Solvent relaxation in biomembranes polarity amount of clustered water (forming solvation envelopes) viscosity restrictions to its motion – packing of molecules a) External interface: from sub ps to ns. b) Headgroup region: pure ns process; mobility of hydrated functional groups c) Backbone region: several ns; water diffusion bulk water: sub-ps
A Defined localization of the fluorophores external interface backbone headgroup region local polarities and viscosities in all regions
A1 + N - - O O Cl P N O DOPC O + N O H O N O O O Prodan O Patman Headgroup labels (DOPC - fluid bilayer) Dn:3750 cm-1 (Prodan); 3000 cm-1 (Patman) Prodan probes largerpolarity τSR:1.0 ns (Prodan); 1.7 ns (Patman) Prodan probes lower “micro-viscosity“
A1 Summary of SR in DOPC vesicles + H - O F + + F O N N - - - O O O O O Cl P P O N O O DOPC O DOPC O + N O O H H O O O N O O O N H O H O H O O O O O Prodan O O O O C DiFU 16 ABA-C 15 9-AS 2-AS Patman • Deeper localisation means probing lower polarity and higher “vicosity” • Significant part within the external interface < 50 ps; partially “bulk” water • Head group labels: “pure” ns SR: bound water to charged and polar groups • Backbone: SR slows down with depth of location: water diffusion Sykora, Kapusta, Fidler, Hof (2002)Langmuir 18 571 (cm-1) 2100 2750 3000 3750 3100 1700 τSR(average)(ns)3.4 2.1 1.7 1.0 0.5 n.d. % SR(<50 ps) 75 95 95 95 85 50
A2 d≈200nm d≈30nm Membrane curvature and headgroup hydration Motivation: membrane fusion, vesiculation, formation of new organelles, ... are intermediated via highly deformed bilayer structures. Small unilamellar vesicles (SUV) = high curvature Large unilamellar vesicles (LUV) = low curvature
A2 d≈200nm d≈30nm Membrane curvature and headgroup hydration • degree of hydration remains constant • relaxation becomes faster with increasing curvature mobility of the dye microenvironment increased when the bilayer is more bent – different packing of the bilayer τSR= 1.2 ns τSR = 0.9 ns J. Sýkora et al. Chem. Phys. Lipids (2005) 135 213
B Solvent relaxation in proteins (haloalkan dehalogenases) Proteins substituting halogens in haloalkans with hydroxyl. Reaction in a tunnel shaped active site The active site of two mutations is investigated by SR – fluorescently labelled substrate + inhibition of enzymatic activity the fluorophore stays for a long time in the active site DhaA DbjA Jesenská et al.JACS(2009) 131494
B Solvent relaxation in proteins (haloalkan dehalogenases) DhaA DbjA Dn (cm-1) 1300 950 tSR (ns) 2.8 4.1 % observed 70 90 The difference correlates with molecular modelling – more polar and mobile in wider tunnel mouth. DbjA has higher enzymatic activity Pure ns dynamics no “bulk” water, water in enzyme active site is structured (like solvation envelope)
Dinitrostilbene in different solvents Dissolved in: • Cyclohexane (nonpolar) • Diethyl ether (medium polar) • Ethylacetate (polar)