Download
1 / 9
90 likes | 294 Vues
Modeling Non-Point Source Pollution and Erosion into Gulf Coast Bays and Marshes. Greg Easson – UM – PI. Background. Nonpoint Source Pollution and Erosion Comparison Tool (N-SPECT) model was designed by the NOAA Coastal Services Center (NOAA-CSC) GIS based modeling systems

E N D
Modeling Non-Point Source Pollution and Erosion into Gulf Coast Bays and Marshes Greg Easson – UM – PI
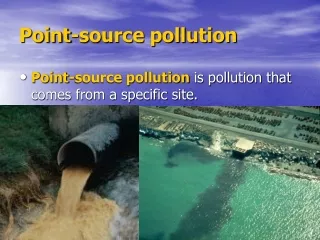
Background • Nonpoint Source Pollution and Erosion Comparison Tool (N-SPECT) model was designed by the NOAA Coastal Services Center (NOAA-CSC) • GIS based modeling systems • Predict potential water-quality impacts from nonpoint source pollution and erosion.
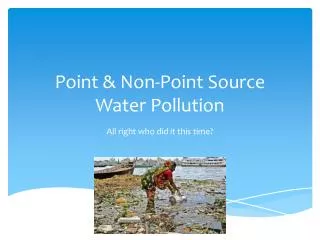
Background • Non-point source pollution is a major contributor to the decline in water quality in coastal areas. • Sources of the pollution; development and land clearing, deforestation, agriculture, lawn fertilizers and farm practices
Background • Users first enter information about their area (land cover, elevation, precipitation, and soil characteristics) to create the baseline information. They can then add different land cover change scenarios (such as a development) to get information about potential changes in surface water runoff, nonpoint source pollution, and erosion.
Objectives • Integrate existing and next generation NASA data streams into the N-SPECT model and test the model on two estuaries in the Gulf of Mexico • Mobile Bay • St. Louis Bay
Model Inputs • Land cover grid - LDCM • Digital elevation model • Precipitation grid - GPM • Pollutant coefficients (based on land cover) • Soil type
Model Outputs • Accumulated runoff, pollutant, and sediment load grids • Pollutant concentration grids • Pollutant assessment grid, which compares the resulting concentrations in receiving waters to user-specified water-quality standards
Project Schedule and Issues • Schedule under development • Research Associate leaving 7-31-07 • Subcontract to NOAA