Collection 6 Cloud Mask (MOD35) Status and Recent Analysis
Collection 6 Cloud Mask (MOD35) Status and Recent Analysis . Richard Frey, Brent Maddux, and Steve Ackerman MODIS Science Team Meeting May 18, 2011. Status: Collection 6 cloud mask has been delivered Original delivery August 2010 (Low Earth Orbiter Cloud Algorithm Testbed)

Collection 6 Cloud Mask (MOD35) Status and Recent Analysis
E N D
Presentation Transcript
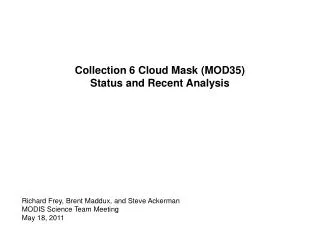
Collection 6 Cloud Mask (MOD35) Status and Recent Analysis Richard Frey, Brent Maddux, and Steve Ackerman MODIS Science Team Meeting May 18, 2011
Status: Collection 6 cloud mask has been delivered Original delivery August 2010 (Low Earth Orbiter Cloud Algorithm Testbed) LEOCAT installed Problems found with 1.38 µm land test thresholds and 7.2-11 µm polar day test; TPW info from ancillary data too coarse spatially 2nd delivery October 2010 Problem discovered when false sea ice in ancillary data led to undetected clouds 3rd delivery November 2010 Ok so far … may need threshold tweaks for use with Collection 6 L1b
MODIS Band 1 Reflectance Washington Baltimore Philadelphia New York Boston July 17, 2006
Global to Large Region Cloud Amount Analysis • - uses Collection 5 MODIS Level 3 Data • monthly/daily means at 1-degree resolution • ten years of Terra, eight years of Aqua • do cloud amount data show expected seasonal variations on a year-by-year • basis (show temporal consistency)? • are spatial patterns consistent with known atmospheric processes? • how close are we to a cloud amount climatology baseline? • in which regions can we establish “climate quality” credibility?
0.0 0.5 1.0 Ten Year Terra Daytime Cloud Fraction 10:30 AM ECT
0.0 0.5 1.0 Eight Year Aqua Daytime Cloud Fraction 01:30 PM ECT
0.0 0.5 1.0 Ten Year Terra Nighttime Cloud Fraction 10:30 PM ECT
Daily Zonal Hovmoller: Terra Daytime Cloud Fraction Latitude -90 0 90 2000 2001 2002 2003 2004 2005 2006 2007 2008 2009 2010 Year
Terra Daytime Mean Cloud Fraction Day of Year
-0.5 -0.4 -0.3 -0.2 0 0.2 0.3 0.4 0.5 Correlation is significant >± .15 for a p-value of .05 Correlation of ENSO and Terra Cloud Fraction
-0.5 -0.4 -0.3 -0.2 0 0.2 0.3 0.4 0.5 Correlation is significant >± .15 for a p-value of .05 Correlation of PNA and Terra Cloud Fraction
Small Region to Local Cloud Amount Analysis – a Wisconsin Example - demonstrate the value of high resolution gridding -**create previously unavailable local cloud amount climatologies? - study cloud processes and interactions with atmospheric phenomena at local scale, e.g. lake breeze, urban heat island, etc. -**analyze systematic biases due to surface type, ancillary data, etc. ----------------- For each granule that overlaps Wisconsin: - place each 1-km pixel (C5 L2) to a fixed grid with resolution of about 1.2 km preserves the pixel level data at nearly the original full resolution results in minimal horizontal movement of pixels between grids - gridding and averaging for Aqua and Terra independently this creates four “looks” at Wisconsin daily
DJF MAM JJA SON 0.4 0.5 0.6 0.7 0.8 0.9 1.0 Wisconsin Seasonal Cloud Amounts from Ten Years of Terra Data
From 10-year Terra Data Set 55.0 57.5 60.0 62.5 65.0 67.5 70.0 72.5 Wisconsin Annual Mean Cloud Amount
Wisconsin 10-Year Cloud Amount Variability Terra daily mean cloud amounts plotted in blue dots for each day between 2001-2010
0.4 0.5 0.6 0.7 Fair weather cumulus over southern Wisconsin June 4, 2008 250 m Resolution Mean Summer Cloud Amount over Madison Mendota Cloud Amount
Conclusions: 1) Collection 6 Cloud Mask (MOD35) is ready as far as we know. 2) Work by Brent Maddux shows that aggregated Collection 5 cloud mask data records atmospheric phenomena as reflected in cloud amounts at large, regional, and local scales.