Exploring Coordinate Planes and Scatter Plots
230 likes | 330 Vues
Learn to plot points on a coordinate plane, draw scatter plots, and make predictions. Understand how to work with linear equations by mastering the coordinate system. Interpret scatter plots to see trends in data and predict outcomes. Challenge yourself with practice problems and check your answers.

Exploring Coordinate Planes and Scatter Plots
E N D
Presentation Transcript
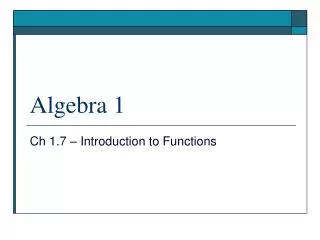
Algebra 1 Ch 4.1 Coordinates & Scatter Plots
Objective • Students will plot points on a coordinate plane • Students will draw scatter plots and make predictions
Before we begin… • Generally speaking, Algebra 1 is the in-depth study of linear equations… • For the next couple of chapters we will spend time looking at various aspects of linear equations…with the ultimate goal of making meaning out of the data… • To work with linear equations we must start at the beginning, which is working with the coordinate plane…
Coordinate Plane • The coordinate plane is formed by two real number lines that intersect at a right angle. • The horizontal number line is called the x-axis • The verticalnumber line is called the y-axis • The plural of axis is called axes • The point at which the 2 number lines intersect is called the origin, which is identified with the ordered pair (0,0)
y x Coordinate Plane Vertical Axis - Y Origin (0,0) Horizontal Axis - X
The Coordinate System • Each point in the plane corresponds to an ordered pair of real numbers • In an ordered pair the x-coordinate is always displayed first, then the y-coordinate Example: (3, 4) This is the x-coordinate This is the y-coordinate
The Coordinate Plane • To plot an ordered pair on the coordinate plane: • Move horizontally along the x-axis and locate the x value. • Then move vertically to locate the y value. • The point at which they meet is the ordered pair. • Let’s look at an example…
y x Example 1 • Plot the ordered pair (3, 4) • In this example 3 is the x value so starting at 0 move 3 spaces to the right on the x-axis • 4 is the y value so move 4 spaces up on the y-axis to find the ordered pair (3,4)
y x Example 2 • Plot the ordered pair (-3, -4) • In this example - 3 is the x value so starting at 0 move 3 spaces to the left on the x-axis • -4 is the y value so move 4 spaces down on the y-axis to find the ordered pair (-3,-4)
y x The Coordinate Plane • The coordinate plane is comprised of four quadrants which are labeled counter-clockwise, using Roman Numerals, starting in the upper right hand corner. Quadrant II Quadrant I Quadrant III Quadrant IV
y x The Coordinate Plane • In each quadrant the x and y values can be positive or negative as follows: x = negative y = positive x = positive y = positive x = negative y = negative x = positive y = negative
Scatter Plots • A scatter plot is a graph that shows the relationship of two sets of data, which can be graphed as an ordered pair… • Scatter plots are used to see trends in data and to make predictions about the future… • A real-life example of a scatter plot is when your parents bring you to the doctor’s for check-ups….the doctor keeps statistics on your height and weight…and uses the information to determine if you are growing and maintaining weight at an appropriate level based upon your age…
Interpreting Scatter Plots • A scatter plot can show three types of relationships… • No Relationship • Negative Relationship • Positive Relationship • After plotting the data you can look at the graph to determine the type of relationship…as shown on the next slide
Types of relationships No Relationship Negative Relationship Positive Relationship
Types of Relationships • As illustrated in the previous slide: • In a no relationship scatter plot the data points appear to be random and have no direction • In a negative relationship the data points appear to be going in a downward direction • In a positive relationship the data points appear to be going in an upward direction
Example #3 • Draw a scatter plot of the given data In this example the data above becomes the ordered pairs, with the TV size being the x-value and the price begin the y-value. The data is plotted on the next slide…
700 600 500 400 300 200 100 0 15 25 35 45 55 (36, 659) (32, 499) Price ($) (27, 349) (19, 179) TV Size (in)
Interpreting the Data • After plotting the data in the scatter plot we can see that a relationship has formed between the size of the TV and the price of the TV. • In this example the data is going in an upward direction meaning that there is a positive relationship… • From the data and the relationship illustrated in the scatter plot we can make the statement “The larger the size of the TV the more it will cost.” • We can also predict that a 40 inch TV will cost between $700 and $800.
Comments • On the next couple of slides are some practice problems…The answers are on the last slide… • Do the practice and then check your answers…If you do not get the same answer you must question what you did…go back and problem solve to find the error… • If you cannot find the error bring your work to me and I will help…
Your Turn • Draw and label a coordinate plane. Plot and label the ordered pairs. (Use a separate Coordinate Plane for each set of points) • A(0,3), B(-2,-1), C(2,0) • A(0,0), B(2,-2), C(-2,0) • A(3,-5), B(1.5, 3), C(-3,-1)
Your Turn • Without plotting the point identify the Quadrant: • (5,-3) • (6,17) • (-5,-2) • (-5,6) Make a scatter plot of the data Identify the relationship as positive, negative, or no relationship What statement can you make about the relationship of time and temperature? Predict what the temperature will be at 9:00
Summary • A key tool in making learning effective is being able to summarize what you learned in a lesson in your own words… • In this lesson we talked about The Coordinate Plane and Scatter Plots Therefore, in your own words summarize this lesson…be sure to include key concepts that the lesson covered as well as any points that are still not clear to you… • I will give you credit for doing this lesson…please see the next slide…
Credit • I will add 25 points as an assignment grade for you working on this lesson… • To receive the full 25 points you must do the following: • Have your name, date and period as well a lesson number as a heading. • Do each of the your turn problems showing all work • Have a 1 paragraph summary of the lesson in your own words • Please be advised – I will not give any credit for work submitted: • Without a complete heading • Without showing work for the your turn problems • Without a summary in your own words…