(Average Ratio is 1.76)
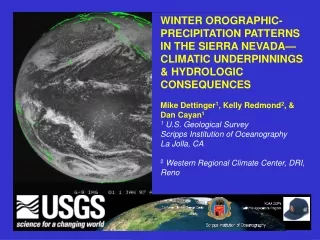
WINTER OROGRAPHIC-PRECIPITATION PATTERNS IN THE SIERRA NEVADA—CLIMATIC UNDERPINNINGS & HYDROLOGIC CONSEQUENCES Mike Dettinger 1 , Kelly Redmond 2 , & Dan Cayan 1 1 U.S. Geological Survey Scripps Institution of Oceanography La Jolla, CA 2 Western Regional Climate Center, DRI, Reno.


(Average Ratio is 1.76)
E N D
Presentation Transcript
WINTER OROGRAPHIC-PRECIPITATION PATTERNS IN THE SIERRA NEVADA—CLIMATIC UNDERPINNINGS & HYDROLOGIC CONSEQUENCES Mike Dettinger1, Kelly Redmond2, & Dan Cayan1 1 U.S. Geological Survey Scripps Institution of Oceanography La Jolla, CA 2Western Regional Climate Center, DRI, Reno
Why should we care? Most of our water comes from high altitudes, and yet most of our observations of precip come from low elevations.
Also, the strength of orographic gradients influences runoff timing and the sizes of floods. Simulated Runoff Responses to Imposed Orograpic Gradients North Fork American River, Sierra Nevada 1983
Simulated Snowpack Changes with Imposed Orograpic Gradients North Fork American River, Sierra Nevada 1983 High vs low Basinwide --> Basinwide snowmelt comes earlier
So, how and why does the ratio of precipitation at low- and high-altitude stations on the west slope of the Sierra Nevada vary? High-altitude site Low-altitude site
300 mb Water-vapor transport rates and directions were vertically integrated from surface to 300 mbars each day , 1948-2000, in the NCEP/NCAR Reanalysis products to arrive at a daily transport vector through each grid cell (assuming linear variation of q, u, & v between levels) … + + 700 mb + q v dp/g = 850 mb +/- 10%? + 925 mb + Surface
Transport vectors provide a focused perspective on storm-time thru seasonal-scale circulations & conditions (New Years 1997)
Differences between the averages of transports during 180 LARGE-STORM DAYSvs 180 SMALL-STORM DAYS, Dec-Feb 1949-99 L
Differences between the averages of transports during 180 STRONGLY OROGRAPHIC STORMSvs 180 WEAKLY OROGRAPHIC STORMS, Dec-Feb 1949-99 L
14 Low Ratio Winters Composite October-March 700 mb Departures 11 High Ratio Winters
No obvious “special” layers or reversals to prohibit vertical averaging, at least in the means.
Locally, orographic storms (winds) blow from somewhat more westerly directions than do “large” storms. IN MAP VIEW: MODE OF OROGRAPHIC STORMS MODE OF LARGE STORMS
Thus, orographic storms are NOT always the largest… Although, almost by definition, they often are large.
L Transport paths significantly associated with El Ninos
La Nina storms are strongly inclined towards “orographic” approaches… So they provide more of the most strongly orographic storms.
L Transport paths associated with North Pacific decadal variations
Despite large looking correlations, PDO modifies storm directions and orographic gradients only modestly.
This approach might even be used to project how orographic precipitation would be under global warming scenarios. e.g., PCM ---> marginally weaker orography
Wet! CONCLUSIONS Winds that carries moisture directly across the range yields most precipitation, but orographic influences may require a bit more westerly approaches. La Ninas (and, perhaps, negative PDOs) may provide slightly more orography as a result. Other factors being equal, stronger orographic gradients yield later snowmelt & river discharge; weaker gradients threaten larger flood peaks. Orographic!