Download
1 / 10
100 likes | 127 Vues
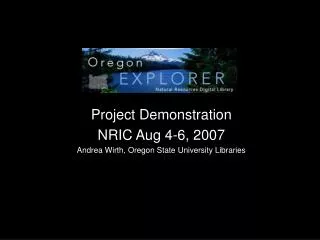
Explore different mashups created by Oregon Explorer that combine data from various sources to create interactive spatial data web applications. These mashups focus on specific themes, allowing users to overlay informational layers, create active objects, and access 3D functionality.

E N D
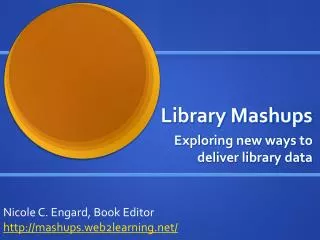
What is a mashup? Mapping API (google maps, bing maps, etc) • a mashup is a web page or application that combines data or functionality from two or more external sources to create a new service. • The term mashup implies easy, fast integration, frequently using open APIs and data sources to produce results that were not the original reason for producing the raw source data. • Source: Wikipedia. Spatial Data Web application
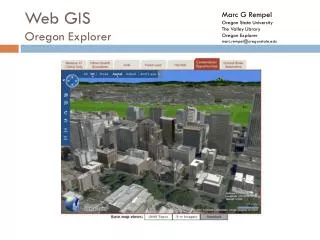
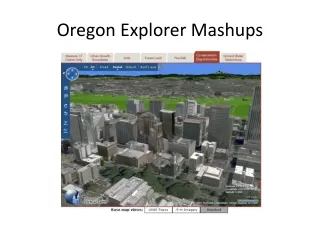
Oregon Explorer Mashups • Why Oregon Explorer uses mashups: • Focuses around a particular topic theme. • Engaging, interactive interface. • More flexibility in how to present maps and content.
Measure 37 Viewerhttp://oeapp.oregonexplorer.info/M37Viewer • Explores Measure 37 claims with the ability to overlay informational layers. • Virtual Earth/Bing Maps- JavaScript API • Overlay Web Map Service (WMS) from ArcIMS • Transparency slider, legend • Create active objects (pushpins, polygons). • Uses GET_FEATURES call to ArcIMS to draw polygons. • 3D Functionality.
ORWAP- Oregon Rapid Wetland Assessment Protocolhttp://oregonexplorer.info/wetlands/ORWAP/ • Creates a habitat sensitivity score for a selected point. • Uses ArcGIS server map and geometry services. • Buffers selected point and queries intersection of layers. • Uses Bing Maps JavaScript Extension for ArcGIS server.
Oregon Watershed Restoration Toolhttp://oregonexplorer.info/OregonRestorationVisTool/ • Displays restoration project information by basin and watershed councils. • ArcGISServer 9.3.1 mapping backend • REST and SOAP used for getting layer data and overlaying WMS. • DOJO JavaScript class library for more interactive user interface.
Components of Web GIS 1. Spatial Data • Shapefiles/ Geodatabases (ESRI) • KML/KMZ (Google Earth) • GeoRSS/GeoJson 2. Mapping Server • ArcIMS / ArcGIS Server • GeoServer • MapServer 3. Web servers • Apache Tomcat • IIS (windows) • 4. Mapping Application • ESRI WebADF/JS APIs • Google Maps API /ArcGISExtension • Google Earth API • Bing Maps API /ArcGIS Extension • Bing Maps Silverlight API (Microsoft) • Flex (Adobe) / ArcGIS Extension • Yahoo Maps API • OpenLayers API • ArcGIS for iPhone API coming soon. • 5. Mapping Enhancements • JavaScript Class Libraries • Dojo, EXT.JS, YUI, jQuery
A simple web mapping application • Basic HTML and JavaScript will get you a long ways.
ESRI Resource Center http://resources.esri.com/arcgisserver/index.cfm?fa=home
For more information • Contact: Marc G. Rempel- marc.rempel@oregonstate.edu