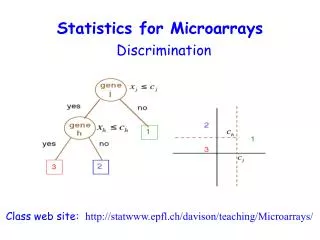
Statistics for nMRCGP
Statistics for nMRCGP. Jo Kirkcaldy. Curriculum Condensed Knowledge. Incidence and prevalence Specificity and sensitivity Positive and negative predictive values Absolute risk and absolute risk reduction Relative risk and relative risk reduction NNT and NNH Odds and odds ratio

Statistics for nMRCGP
E N D
Presentation Transcript
Statistics for nMRCGP Jo Kirkcaldy
Curriculum Condensed Knowledge • Incidence and prevalence • Specificity and sensitivity • Positive and negative predictive values • Absolute risk and absolute risk reduction • Relative risk and relative risk reduction • NNT and NNH • Odds and odds ratio • Hazard ratios
Incidence and Prevalence • Incidence • The number of new cases of a disease/condition occuring in a population over a given time period • Prevalence • The number of existing cases of a disease/condition in a population at a specific point in time
Specificity and sensitivity • Relevance is in screening and diagnostic tests • Sensitivity = true positive rate • i.e. chance of a positive test result for people with the disease • Specificity = true negative rate • i.e. chance of a negative test result for people without the disease.
Sensitivity and specificity Sensitivity = a/a+c (x100) Specificity = d/b+d (x100)
Positive and negative predictive values • Measure screening performance (i.e post test probability) • Positive predictive value • Chance of disease for person with positive test result • Negative predictive value • Chance of no disease for person with negative test result
PPV and NPV • PPV = a/a+b • NPV = d/c+d
Risk • Used in prospective studies • Absolute risk – chance of developing disease/death over a set time period • Relative risk - compares chance of developing disease/death in two groups e.g. with and without treatment over set time period
Absolute risk of death for condition = 53/199 = 0.266 (x 100) • Relative risk of death(risk ratio) = 21/100/32/99 = 0.21/0.323 = 0.65 • Relative risk reduction = 1-0.65 = 0.35 = 35%
NNT and NNH • Related to risk • Calculate how many patients need to save one life/harm one person
NNT = 1/risk difference (=ARR) • Risk difference = 32/99-21/100 = 0.323-0.21 = 0.113 • NNT = 1/0.113 = 9 • Need to treat nine people to save one life
Odds and odds ratio • Used in retrospective studies • Odds of death • control = 32/99/67/99= 0.478 • drug = 21/100/79/100= 0.266 • Odds ratio = 0.266/0.478 = 0.55
Hazard ratios • Reflects time survived to an invent i.e. survival data. • Complicated log calculation but essentially calculates ratio of rates at which an event happens. • E.g if 1000 patients have an MI and 500 are thrombolysed hazard ratios could be used to describe the time to death in each group.
Curriculum Condensed Knowledge • Incidence and prevalence • Specificity and sensitivity • Positive and negative predictive values • Absolute risk and absolute risk reduction • Relative risk and relative risk reduction • NNT and NNH • Odds and odds ratio • Hazard ratios
Further useful references • ‘How to read a paper’ Trish Greenhalgh – pubilshed in serial form in BMJ or available as a book.