Download
1 / 18
180 likes | 303 Vues
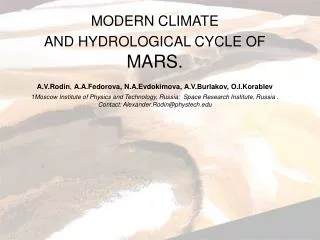
Mars Seasonal South Polar Atmospheric Dust Opacity and Distribution. Drew Wasikoski of NAU Mentored by Dr. Timothy Titus of the USGS. Background. Similarities to Earth: Similar Tilt Seasons Differences from Earth: CO 2 polar caps 25% atmosphere cycled through polar caps annually

E N D
Mars Seasonal South Polar Atmospheric Dust Opacityand Distribution Drew Wasikoski of NAU Mentored by Dr. Timothy Titus of the USGS
Background • Similarities to Earth: • Similar Tilt Seasons • Differences from Earth: • CO2 polar caps • 25% atmosphere cycled through polar caps annually • Mars Year (MY) • 1.9 Earth Years • MY 1 = 1955
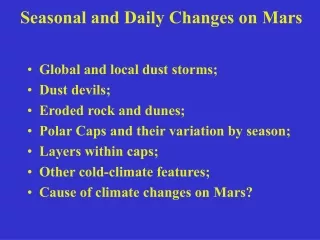
Defining Season (Ls) Southern Winter (Northern Summer) Southern Spring (Northern Autumn) Southern Fall (Northern Spring) Southern Summer (Northern Winter)
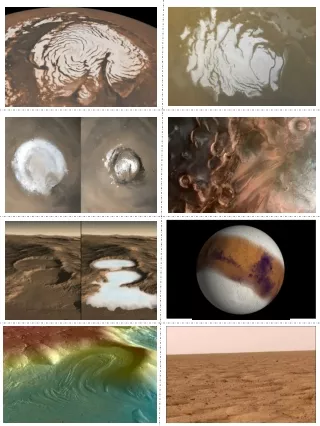
South Polar Cap • South Seasonal Cap • Two Climate regions • Bright • Snow • Dark • Transparent Ice • Dirty Ice • Cap Sublimes in the Spring *Photo courtesy of Glen Cushing
Spring Sublimation • Sublimation of Cap • May bring dust from ice surface into atmosphere • Creates over pressurized zone which could keep atmospheric dust out • How much atmospheric dust is over the cap?
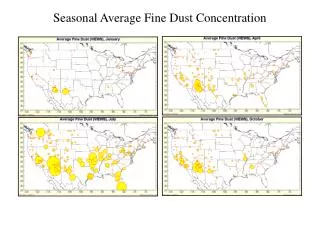
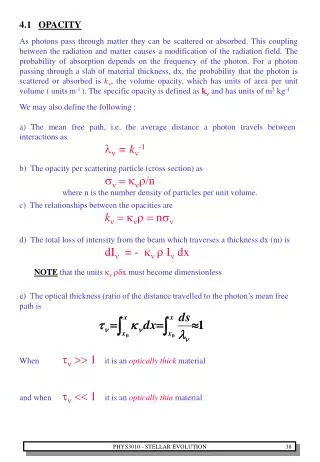
Dust Opacity • When analyzing atmospheric dust opacity we look at the band depth of the 9 µm wavelength • The most commonly used method for collecting opacity data is the Nadir technique (looking straight down at the surface as you fly over) • Nadir fails over cold surfaces and thus Smith gets gaps in his results *Smith [2003]
Data • Emission Phase Functions (EPF) Extinction Curve inreverse • EPF sequence allows for separation of surface and atmospheric components • EPFs taken by Mars Global Surveyor (MGS) Thermal Emission Spectrometer (TES) Data taken during MY 24 and 26
The Procedure Wavenumber (cm-1) Emissivity Opacity Wavenumber (cm-1) Wavenumber (cm-1)
Atmospheric Analysis • Band Depths of 9 μm and 20 μm features determined • 9 µm Band Depth is a proxy for Atmospheric Dust Opacity • Compared our dust opacity distributions to previous results • Dust opacity results above the over pressurized cap
MY 24 EPF Comparison • Both data sets taken during Mars Year 24 with MGS TES • Smith used Nadir imaging technique to acquire his data • We used EPF collection technique to acquire our data • Plotted Opacity • Low Medium High *Smith [2003]
Results of MY 24 EPF Comparisons • Overlapping sections correlate extremely well • Our TES EPF data is consistent with TES Nadir data • EPF data stretches further into colder regions • EPFs can measure opacities in regions where Nadir fails • We see signs of dust penetrating into the polar region
MY 26 EPF Comparisons • Both data sets taken during Mars Year 26 • SmithusedTHEMIS data taken by Mars Odyssey using the Nadir Technique • We usedTES data taken by MGS using EPF technique • Plotted Opacity • Low Medium High *Smith [2009]
Results of MY 26 EPF Comparisons • Overlapping section correlate extremely well (YET AGAIN) • Our TES EPF data is consistent with THEMIS Nadir data • EPF data still stretches further into colder regions • EPFs consistently measures opacities in regions where Nadir fails • We see more signs of dust penetration over the cap
Results: Seasonal Dust • Do we see a change in opacity any time during the season? Yes! In both years studied we see a steady rise in dust opacity from around 200 < Ls < 250 *Smith [2003]
Results: Seasonal Dust • Do we see a change in opacity any time during the season? Yes! In both years studied we see a steady rise in dust opacity from around 200 < Ls < 250 • Evidence of dust storm penetration seen over polar regions • In MY 26 we even see signs of a global dust storm in our data • Validates the EPF data • *Smith [2009]
Summary • Are EPFs a reliable and consistent way to measure atmospheric dust opacities over the South Pole? • EPFs are consistent with previous data collection techniques • EPFs work in colder regions where previous techniques fail • What kind of atmospheric dust opacity distribution do we see over the southern cap as it sublimes? • Subliming cap lifts dirt into air increasing atmospheric dust opacity • Global dust storms penetrate pressure zone altering distribution further
Acknowledgements I’d like to give thanks to all of you for being here and a special thanks to: • Dr. Timothy Titus with the USGS (My mentor) • The Arizona Space Grant Consortium • NAU Space Grant • NASA