Download
1 / 16
160 likes | 337 Vues
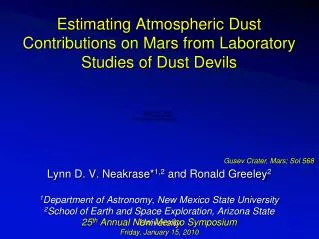
Estimating Atmospheric Dust Contributions on Mars from Laboratory Studies of Dust Devils . Lynn D. V. Neakrase* 1,2 and Ronald Greeley 2 1 Department of Astronomy, New Mexico State University 2 School of Earth and Space Exploration, Arizona State University. Gusev Crater, Mars; Sol 568.

E N D
Estimating Atmospheric Dust Contributions on Mars from Laboratory Studies of Dust Devils • Lynn D. V. Neakrase*1,2 and Ronald Greeley2 • 1Department of Astronomy, New Mexico State University • 2School of Earth and Space Exploration, Arizona State University Gusev Crater, Mars; Sol 568 25th Annual New Mexico Symposium Friday, January 15, 2010
Why is sediment flux important? • Atmospheric dust problem on Mars • Boundary layer winds • Gusts • Dust storms • Dust devils • Martian weather • Dominated by the movement of dust • Spacecraft and human exploration • Hazards and benefits NASA/JPL/Cornell Gusev Crater
Arizona State University Vortex Generator • Laboratory-sized dust devils
Vortex Sediment Flux • Test plate (~5mm deep) filled with sediment • Plate rests on electronic balance • Timed exposure to the vortex • Measure the mass loss as a function of time (∆m) Q = ∆m / ∆t / πrc2
Comparison of Environments Q∝(∆P/uθ)4
Application to Mars • Purpose: To estimate dust fluxes from the surface where estimates of dust flux have not been made • Compared to Gusev statistics from the first dust devil season to compare to lab values • Best observational stats for dust flux • Compared to other sites using lander data from VL1, VL2, MPF • Used orbiter estimates for Amazonis based on Fisher et al., 2005 and Stanzel et al., 2006
Application to Mars VL2 Amazonis VL1 MPF MER-A USGS/NASA/GSFC
Approach • Use the natural dust devil frequencies determined by observation • Substitute average fluxes from ASUVG experiments • Vortex sediment fluxes are scaled by core cross-sectional area and ∆P strength • N(Q•Ac•∆t)/At • N - number of dust devils • Q - average sediment flux • Ac - average area of core of a dust devil • ∆t - average duration of a dust devil • At - total surface area studied
Gusev Crater • Comparison to observation • (Greeley et al., 2006) estimated 19 kg km-2 sol-1 • Laboratory estimates ~3.7 to 28 kg km-2sol-1 • Factors: • Lab vs. natural strength martian dust devils ↓ • Density of materials (walnut shells vs. silicates) ↑2 • Surface roughness could increase lifting ~20% ↑ • Duration of dust devils ↑8-10x
Viking 1, 2, Pathfinder • Comparison to observation • Distributions were estimated from meteorological data • Sediment/Dust Fluxes were poorly constrained • Apply the relationship using the ASUVG estimates • Estimate MPF and VL1 as similar dust contributions • VL2 as lowest Totals: 0.003 - 0.220 kg km-2 sol-1 MUCH less than Gusev
Amazonis • Comparison to observation • Distributions estimated from orbiter images • Resolution limits total numbers observed • Apply the relationship using the ASUVG estimates • Assume the largest dust devils from Gusev (comparable to those from images) are top 1% Totals: 3.4 - 42 kg km-2 sol-1 About as active as Gusev
Results Published ASUVG *Amazonis - Larger area and more large, strong dust devils
Conclusions • Represents the first attempt to put laboratory results to use as predictive tool • Predicts dust contribution from dust devils based solely on frequency information • Shows variability in dust devil contributions from different areas
What next? • Mapping of dust devil frequencies for different areas (diurnal/seasonal) • More experiments for small roughnesses and more low pressure flux runs • Possible correlation of lab mechanical fluxes to thermal flux studies