Visual Presentation
Visual Presentation. For categorical data, pie charts can be effective in their simplicity for portraying relative frequencies. Pie chart to show percentages of each smoking status in a sample of 211 women. You can try various things to spice up the chart.

Visual Presentation
E N D
Presentation Transcript
For categorical data, pie charts can be effective in their simplicity for portraying relative frequencies. Pie chart to show percentages of each smoking status in a sample of 211 women.
You can try various things to spice up the chart. The inclination and distortion that produce the 3D effects make it difficult to interpret the data. In the view below, the Hazelnuts (4%) and the Cashews (8%) look the same. You should avoid using such distortions.
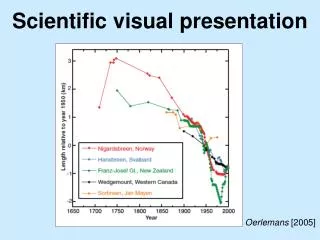
When both variables are continuous it is helpful to produce a graph, called a scatterplot, of one against the other. Axes for any continuous variable on any graph should be chosen with a suitable scale and, importantly, should make it very clear if a “false origin” is used.
Is this a real trend ? How might we check ?
Tabular Presentation: Crosstabs Table 1. Percentage of people in England and Wales rating theirhealth as “not good”: data from Census 2001
Tables clearly give actual numbers involved. They can be colour coded to represent statistical significance. Very hard to misinterpret a table. However with a large numbers of data can get overwhelming.
Bar charts are similar to histograms, but are used to represent data classified into categories. The widths of blocks are always equal and there are spaces between the blocks. Bar chart showing the number of people in each of four groups.
Clustered and stacked bar charts are used to describe two or more categorical variables simultaneously. Stacked bar chart showing the number of people of each gender, within each of four groups. Clustered bar chart showing the percentage in each group within each gender.
100% stacked vertical bar chart Difficult to make comparisons among the second, third, or subsequent segments in a stacked bar because judgment is not being made from a common base. Which region has largest proportion of males 35-64?
3d barchart What % of abortions in England at gestation< 10 weeks?
3d barchart What % of abortions at 13+ gestation in East Midlands?
What % of abortions at 13+ gestation in East Midlands? What % of abortions in England at gestation< 10 weeks?
Horizontal Bar Chart Spurious ranking somebody's got to be at the bottom No consideration of multiple comparisons Encourages comparison when perhaps not justified 95% CI’s arbitrary
Dot plot with Confidence intervals Gives a better visual representation of the width of confidence intervals, useful when CI’s are wide. Not a standard graph format in excel
Line charts display the same information as bar charts except that the line connects the midpoints of tops of corresponding bars. Line charts are preferable to bar charts when there are many categories or a continuous variable. Line chart showing trend of frequencies of days spent in hospital. This connects mid-points of the top of bars for the corresponding bar chart, with straight lines.
Line Chart Life Expectancy at Birth Target = by 2010 increase LE to 78.6 years for men and to 82.5 years for women Useful for looking at trends of time LE Gap = 5 years
Not using a consistent scale leads to misrepresentation of trends.
Histograms are used to depict numeric variables. The areas of rectangles represent numbers of cases. If the widths of the rectangles are all the same, then the height of the blocks is proportional to the observed frequencies. Histogram showing the distribution of the number of days stayed in hospital. Short lengths of stay (less than 4 days) were more common than longer ones.
Histogram • Means of summarising the frequency distribution of a single variable eg. Age distribution of North Notts residents off Exeter system • Use where you havent already got the frequency distribution provided • Easiest to do if have stats package Like SPSS or can use Data Analysis Tools add-in in Excel • Alternatively use Access to get frequency count and export into Excel and do bar chart
Histogram: Age Distribution of 1% random sample off N Notts Exeter
Figure 10 Histogram with normal-curve and statistics for cholesterol measurements. useful for illustrating the shape of the distribution of a batch of numbers
Mean=6.6 Figure 10 Histogram with normal-curve and statistics for cholesterol measurements. useful for illustrating the shape of the distribution of a batch of numbers
Mean=6.6 Mode Figure 10 Histogram with normal-curve and statistics for cholesterol measurements. useful for illustrating the shape of the distribution of a batch of numbers
Mean=6.6 Mode Median6.4 Figure 10 Histogram with normal-curve and statistics for cholesterol measurements. useful for illustrating the shape of the distribution of a batch of numbers
Boxplots are graphical representations which clearly show the quartiles and extremes or outliers of a set of data in a compact manner. Boxplots showing the distribution of 2-hour blood glucose among males and females.
Boxplots are graphical representations which clearly show the quartiles and extremes or outliers of a set of data in a compact manner. Minimum Outliers “unusual observations” 1st Quartile 3rd Quartile Maximum Median Boxplots showing the distribution of 2-hour blood glucose among males and females.
Radar Chart or Spider Chart Allows the comparisons more than one group across a few different values
Population Pyramids population pyramids for districts and regions comparing against the age-gender distribution for the UK as a whole: available on the ONS website under “Census 2001” East Midlands Region Not standard excel format
Spine charts- many different types, used for displaying lots of information of different variables The range to the left and right is not necessarily equal The range of clusters can be greatly distorted by one outlying point
No statistical significance Variables with small variance from mean will be hard to spot
Statistical Process Control Charts • Used to detect and monitor process improvement over time • Easy to read guide which allows you to take appropriate action • Provides an understanding of process over time and capability of achieving targets • Distinguish between • Controlled (Chance) variation • Stable and stays within process limits • Uncontrolled (assignable) variation • Pattern changes over time and/or breaches control limits
Funnel Plots • No ranking • Data Displayed • No preset threshold for out of control • Visual relationship with volume • Emphasises increased variability of smaller centres
Teenage pregnancy - Conceptions below age 18 (change in rate)CHI Indicator: Percentage change in the under-18 conception rate between 1998 and 2001.
Exercise • List 3 advantages and 3 disadvantages to Funnel plots
X-Bar and R Chart • Traditional chart – data points with mean and control limits • The X-bar chart monitors the mean over time, based on the average of a series of observations, called a subgroup.
X-Bar and R Chart • Does not allow us to monitor progress in terms of the targets set out by the DH
SPC chart with Targets • Has targets instead of mean of data points • The “Action limits” are similar to control limits – are 2 and 3 SD’s from target • Does not account for different trust sizes and/or number of patients seen
Interpretation and use • When are SPC methods not appropriate? – are we stretching their use? • What if all points lie outside control limits? Is this a: • Bad measure? • Bad system? • Where should control limits be set and how should we decide?
Observations • Relatively simple to create – funnel plots, double square root charts etc, can all be created in Excel (spreadsheets available) • Most people get it and like it when they do • Quick, simple, robust, • Funnel plots convey more information and use “real” units BUT • It’s the pattern that matters • Only a screening tool – tells you where to look first