Download
1 / 16
160 likes | 176 Vues
This presentation discusses the long-term variability of solar activity, including the 11-year cycle, Maunder Minimum, Suess cycle, and solar activity forecasts. Analysis of 14C radiocarbon data, Schove series, and Group Sunspot Number reveals two regimes of solar variability with different cycle lengths. The synthesis reveals an active regime with a 200-year cycle and a low-activity regime resembling the Maunder Minimum. The solar activity forecast suggests a long-term minimum in the upcoming decades, potentially less severe than the Maunder Minimum.

E N D
Long-term Solar Variability and the Solar Cycle in the 21st Century Zasshikai short talk Boncho P. Bonev , Kaloyan M. Penev , and Stefano Sello ApJ 605, L81, 2004
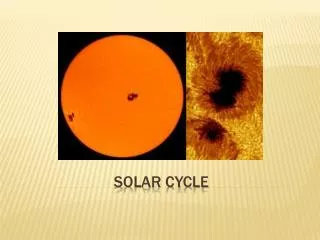
1. Introduction • Variation of the soar activity • 11 year cycle • Maunder minimum • From 1600AD to 1700AD • Long-term variation • Gleissberug period (from optical solar record) • T = 80-90 years 100 years (from recent analysis) • Suess cycle (from aurora record) • T = quasi 200 years • Solar activity forecast ?
2. The Time Series Analyzed 1. The 14C radiocarbon data • 4500 years span, 10 years step • Dendrochronology 2. The Schove series (aurora data) • 1700 years span from 296AD • Quasi 200 year cycle • (Activity in odd century) < (even century) during the past millennium 3. The Group Sunspot Number (GSP) • 400 years span from 1610AD • RG = 12.08/N ∑ki Gi • Gi : number of sunspot group, ki : correction factor N : number of observer, i : observer index
Fig.1 14C data M : Maunder Minimum Large Δ14C value low solar activity
Schove series (aurora) (Komitov & Bonev, ApJ 554, L119, 2001)
Group Sunspot Number (GSN) GSN Wolf (Hoyt & Schatten, SolPyhs, 181, 491, 1998)
3. Approach • Fast-Moving Window Periodogram Algoritm (MWPA) • 800 years subset • Multiresolution Wavelet Analysis (WA)
Fig. 2-1 WA result for 14C data Regime 2 Regime 1 Regime 2 Regime 1
Regime 1 M : Maunder Minimum Large Δ14C value low solar activity
4.2 Two Regimes of the Long-Term Solar Variability • Regime 1 • Strong quasi 200 years cycle • Strognly suppressed 100 years cycle • (130-150 year cycle) • Regime 2 • low 200 year cycle • Unstable and weak 100 year cycle • Schove series (aurora) is very similar to 14C data
4.3 Synthesis • Regime 1 • 210 years cycle • Low activity (Maunder type) • Regime 2 • Overall active
4.3 Synthesis (continue 1) • On the longer time scale • After Maunder Minimum • Weak 200 year cycle • Activity was highest in the middle of 20th century • Changing from regime 1 to 2 ? • On the shorter time scale • Now in the minimum phase of 100 year cycle • In the declining phase of 200 year cycle • Untypical behavior of solar cycle 23 against the Gnevyshev-Ohl rule (the cycle 23 was magnetically weaker than the cycle 22)
4.3 Synthesis (continue 2) • Long-term minimum in the next several decades • Less deep than the Maunder Minimum ?