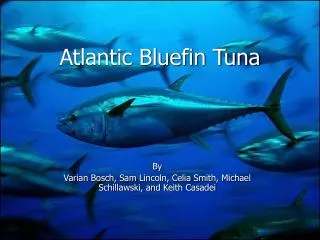
Atlantic bluefin tuna
140 likes | 234 Vues
An overview of the 2006 stock assessment for Atlantic bluefin tuna with insights on management efforts, fishing capacity, and implications for stock recovery. Explore recommendations, concerns, and future prospects for this valuable fishery resource.

Atlantic bluefin tuna
E N D
Presentation Transcript
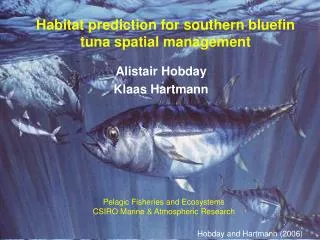
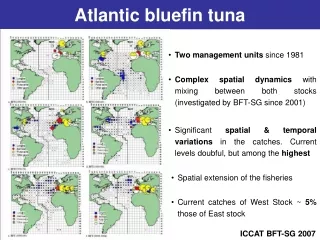
Atlantic bluefin tuna • Two management units since 1981 • Complex spatial dynamics with mixing between both stocks (investigated by BFT-SG since 2001) • Significant spatial & temporal variations in the catches. Current levels doubful, but among the highest • Spatial extension of the fisheries • Current catches of West Stock ~ 5% those of East stock ICCAT BFT-SG 2007
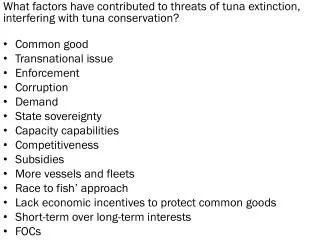
The 2006 stock assessment: a brief reminder BFT-WG has stressed since 2000 strongconcern about data quality, for both total catch and cath-at-size, mostly due to: • Under-reporting of ICCAT members since TAC implementation (1998) • Illegal fishing (under-sized and flag of convenience) • Loss of information in recent years due to caging The BFT-WG concluded in 2004 that itwas no longer defensible to assess the stock using only methods that assume that the catch-at-size/age is known exactly (i.e. VPA), until extensive improvements in fisheries statistics are made For these reasons, besides the update of the VPA, the 2006 stock assessment mostly investigated various approaches, such as catch curve, year-class curve, yield-per-recruit analysis, and based its advice on a larger variety of methods
The 2006 stock assessment: a brief reminder Estimation of fishing capacity in the Mediterranean Sea(based on the number of vessels operating in the Mediterranean Sea and their respective catch rates )
The 2006 stock assessment: a brief reminder Therefore, the Group concluded that real catches since 1998 are more likely to be close to the levels reported in the mid-1990s, i.e. ~ 43,000 t in the Mediterranean and about 50,000 t in the East Atlantic & Mediterranean
VPA SSB continues to decline while Fs are increasing rapidly, especially for large fish • Recent decline for older fish The 2006 stock assessment: a brief reminder CPUE • No trend on small fish
The 2006 stock assessment: a brief reminder YPR Estimated temporal pattern in monthly catches of spawning size and juvenile BFT in the East Atlantic and Mediterranean Based of that, defined a suite per-recruit analyses that can be considered as long-term evaluations of alternative minimum size (10, 25 and 30kg) and closure options in time (June, May-June, etc..) and space (East Atl. vs Med)
The 2006 stock assessment: a brief reminder Projecting 2004 1970
The 2006 stock assessment: a brief reminder Conclusion • TAC regulation until 2006 was not respected and was largely ineffective in controlling overall catch • The 2003-2004 fishing mortality rates would lead to F that would be more than 3 times FMax and would drive the SSB to a very low level (~ 6% SPR) • Fishery and stock collapse in the near future is a possibility given our estimations of current fishing capacity and fishing mortality rates.Substantial reductions in F and catch are thus needed (~15,000 tonnes for short-term) • Among a number of alternative management scenarios, only those with a closure of the Mediterranean around spawning season together with an increase in minimum sizecan lead to a recovery of the stock
The 2006 recovery plan A TACof 29,500; 28,500; 27,500 and 25,500 tonnes/year for 2007, 2008, 2009 and 2010 An extended closed fishing season:(i) from the 01 June to 31 December for large LL, (ii) from the 01 July to 31 December for PS and (iii) from 15 November to 15 May for BB & TRW A minimum size being extended to 30 kg(with a tolerance of 8 %) and the exception of BB and TRW in the East Atlantic and catches for farming purposes in the Adriatic Sea for which the minimum size is set at 8kg Multiple elements related to monitoring, control and surveillance associated measures to the TAC
The 2007 BFT-SG Investigation of the effects of this recovery plan on stock status 1. Through the interpolations of the yield-per-recruit outcomes
With other plausible assumptions (imperfect implementation and/or lower or declining recruitment) the objectives of the rebuilding plan will not be met. The 2007 BFT-SG Investigation of the effects of this recovery plan on stock status 2. Through simulation models • If implementation is perfect and future recruitment at ~1990s level, there is about 50% probability of rebuilding by 2023 under the current regulations • However, perfect implementation is unlikely, even with perfect enforcement, because avoiding totally discard mortality of small fish and reducing fishing effort to very low levels does not appear to be feasible Overall, preliminary results indicate that the current measures are unlikely to fulfill the objective of the rebuilding plan with 50% probability