Download
1 / 38
380 likes | 574 Vues
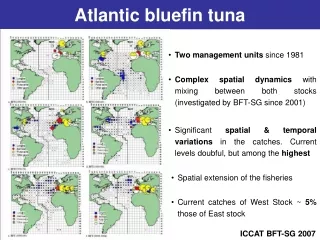
Habitat prediction for southern bluefin tuna spatial management. Alistair Hobday Klaas Hartmann. Pelagic Fisheries and Ecosystems CSIRO Marine & Atmospheric Research. Hobday and Hartmann (2006). Breakthrough Technology I “Physical Observations”. In situ coverage is patchy in space and time

E N D
Habitat prediction for southern bluefin tuna spatial management Alistair Hobday Klaas Hartmann Pelagic Fisheries and Ecosystems CSIRO Marine & Atmospheric Research Hobday and Hartmann (2006)
Breakthrough Technology I “Physical Observations” • In situ coverage is patchy in space and time • Climatologies, no interannual variation • Satellite data provides surface features • Platform coverage, clouds, space • Ocean models (3D, multivariable, space/time coverage) • Short-term • Season/annual • Long-term • Allow new phase of fisheries oceanography
Bluelink product: synTS • synTS (synthetic temperature and salinity) • statistical data product • derived using SSH, SST & climatology for Australian region => temperature at standard oceanographic depths => produced in near real time • David Griffin and team at CSIRO
Breakthrough Technology II“Smart Tags” • Tag technology is making a difference to understanding fish movements and habitat use • New insight into the basic biology of many species • Improved the advice we can provide for management
SBT track Pop-up Satellite Archival Tags
Southern Bluefin Tuna “problem” • World-wide stock at historical low (<10%) • International catch agreement (quota) • Australia abides by this `
Bluefin tuna on the east coast • Bycatch in a longline fishery • Limited quota held on the east coast • Fish are discarded if captured, because cannot be legally sold • Management Goal • Avoid catching SBT (unless own quota)
Minimize non-quota holders catching bluefin tuna(Real-time spatial management) • Zone east coast into 3 regions • Core SBT habitat: 4t quota required for access • Marginal SBT habitat zone: 0.5t quota required for access • Poor SBT habitat zone: no quota required for access • Assist management by identifying present distribution of tuna habitat • First example of using environment information for real-time “management” (in Australia, perhaps unique in world)
Method Biological Data (tags) Physical Data (near-real time distribution of environment) Satellite data synTS (SSH & SST) Habitat Preferences Analysis and habitat prediction tools Habitat Prediction Maps Management Support (sustainable use)
Biological Data: Tag temperatures(based on 45 tags for 2006) • Distribution of temperatures is fish “preference” (e.g. SST) SST
Generate distribution of surface habitat(proportion of time fish spend in water colder than at each pixel)
2. ….then do for sub-surface habitats(using the near-real time ocean model)
3. Sum to create full habitat probability distribution(probability that fish are in water column “colder” than each spot)
Transferring predictions to management • Management-selected habitat probabilities • Core SBT habitat: 80% probability • Marginal SBT habitat zone: 15% probability • Poor SBT habitat zone: 5% probability • Turn continuous habitat probabilities into 3 zones • Each pixel is classified into one of 3 types • Send reports every 1-2 weeks to fishery managers • Decide on lines to divide these zones
Fisheries managers place linesAccepted approach by stakeholders…but how is management doing? • Raw zones are complex shapes • Simple lines needed (1, 2 or 3 segments) • Subjective approach….subject to pressure from stakeholders…. No quota Limited quota Quota zone
OK: correct Buffer: incorrect Core: incorrect Buffer: correct OK: incorrect Core: incorrect Buffer: incorrect Core: correct OK: incorrect Misclassified pixels
Objective function… . …seeks to balance the contribution of non-precautionary (blue) and precautionary (orange) misclassifications to the score
Line placement 7 AFMA Optimiser
Classification success AFMA: Precautionary bias: red bar > aqua bar (n=2) AFMA: Non-precautionary bias: aqua bar > red bar (n=5) Optimizer: no bias yellow bar = brown bar (n=7) 1 2 3 4 5 6 7
Human vs Machine • Correctly-classified habitat (~80% of habitat area) • Computer wins 5/7 placements • When management did better….strong bias to precautionary or non-precautionary • No bias in line placement? • Computer 7/7 placements • Managers 0/7 • Non-precautionary bias (disadvantage fish) • Managers: 5/7 times • Precautionary bias (disadvantage fishers) • Managers: 2/7 times
Summary Effective management support tool • Using biology + physics => management • Real time, adaptive…. This season (ended Oct 2006, next start May 2007) • Include more tags (57) • Provide computer line placement as a guide • Encourage more rapid response to predictions Future • Email daily habitat prediction (but lines can jump, QC) • Continued validation (observer data in all zones) • Habitat predictions for other species
Effect of delays in placement Zones moving south (1 day delay) Zones moving north (1 week delay) Implementation date Implementation date Model date Model date Disadvantage fish (by 7 days) Disadvantage fisher (but only by 1-day) SBT habitat can be fished SBT habitat with extra protection
Validation: How good is the prediction?Compare captures of SBT in each of the zones Cumulative probability of SBT habitat: • E.g. 20% sets in waters where cumulative prob of SBT presence is <70% SBT sets • e.g. 50% of the SBT were captured in waters where they are predicted to spend 50% of their time….. Future: catch per zone (f, wt)
Management maps Examples of maps distributed online to stakeholders