Download
1 / 13
130 likes | 268 Vues
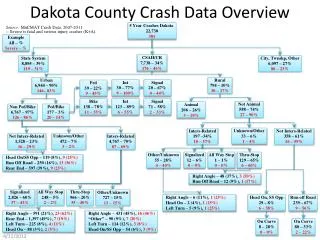
City of Evansville and Vanderburgh County Intersection Crash Analysis. Study Overview. The study . . . Identifies problem intersections and determines suitable improvements Uses 2001 calendar year crash data from the City Police and County Sheriff

E N D
City of Evansville and Vanderburgh CountyIntersection Crash Analysis
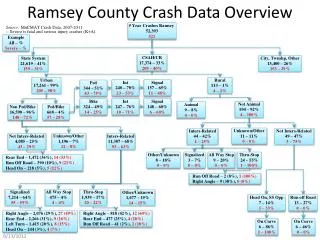
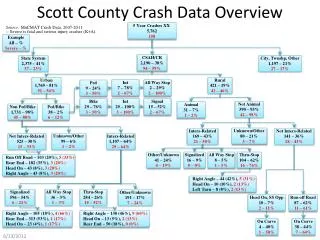
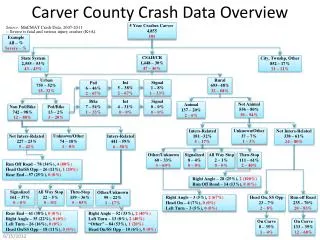
Study Overview The study . . . Identifies problem intersections and determines suitable improvements Uses 2001 calendar year crash data from the City Police and County Sheriff Analyzes intersections with 5 or more crashes Provides recommendations for intersections with 10 or more crashes or a crash rate of 3.0 or higher
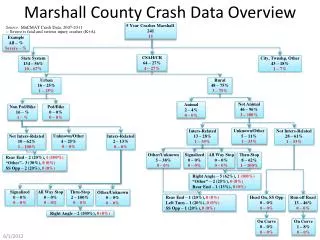
Study Overview and History Overview: Over 3,500 Crash Reports were reviewed 276 intersections with 5 or more crashes 233 in Evansville and 43 in Vanderburgh Co. History: 1985 – 89 intersections with 5 or more crashes 1992 – 176 intersections with 5 or more crashes
Methodology Crash Rate – Represents the number of crashes that are expected to occur for every one million vehicles that enter the intersection. (A) (1,000,000) R = (T) (V) R – Rate A – Number of Crashes T – Time (365 days) V – Traffic Volume
Methodology Severity Crash Rate – Represents the number of injury or fatal crashes that are expected to occur for every one million vehicles that enter the intersection. (I+F) (1,000,000) R = (T) (V) R – Rate I/F – Injuries and Fatalities T – Time (365 days) V – Traffic Volume
Driver Factors in Crashes Driver Inattention – 31.9% Disregard Traffic Control – 13.5% Following to Close – 12.7% Lane Change – 4.6% TOTAL – 62.7%
Crash Types Rear Ends – 44.4% Broadsides – 35.3% Sideswipes – 8.6% Hit Object – 4.0% Head On – 1.8% Bicycle/Pedestrian – 0.7% Other – 5.2%
3. Court Street and NW 2nd Street (City of Evansville) Total Crash Rate 4.98 Crash Severity Rate 1.99 Total Crashes 20 Est. Property Damage Cost $78,000 Total Injury Crashes 8 Total Injuries 10 Est. Injury Cost $365,000 Crash Type Broadside 15 75% Head On 2 10% Side Swipe 2 10% Rear End 1 5% Driver Factor Disregard Traffic Control 10 50% Failure to Yield 8 40% U-Turn 1 5% Lane Change 1 5%
Recommendations Low Cost Improvements where applicable: Review Signal Timing Increase Police Surveillance Review All Red Clearance Review Right-of-way Control Corridor Analysis for more significant projects Lincoln Avenue Covert Avenue Washington Avenue
Recommendations Work with local and state agencies to promote driver education initiatives Public Outreach Programs Crash Awareness Week High School Education Outreach Publish Driver Safety Pamphlets and Newsletters
Contact Information Doug Lane (812) 436-7836 mlane@eutsmpo.com Brian Howard (812) 436-7837 bhoward@eutsmpo.com Evansville Urban Transportation Study Civic Center Complex, Room 316 1 NW Martin Luther King Jr. Boulevard Evansville, IN 47708