Download
1 / 13
130 likes | 370 Vues
FIELD VALUE A field value is a measurement taken in the environment. There are two types 1) scalar and 2) vector. Scalar field values – are measurements that only describe magnitude (how much – amount) Examples – temperature

E N D
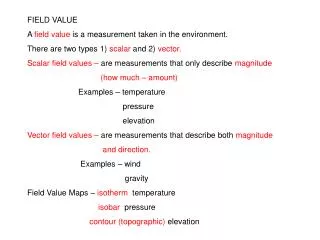
FIELD VALUE A field value is a measurement taken in the environment. There are two types 1) scalar and 2) vector. Scalar field values – are measurements that only describe magnitude (how much – amount) Examples – temperature pressure elevation Vector field values – are measurements that describe both magnitude and direction. Examples – wind gravity Field Value Maps – isotherm temperature isobar pressure contour (topographic) elevation
Field values are plotted on a map according to the location that the measurement was taken. Field values that are the same number are then connected to each other to create lines of equal value called isolines. DO NOT CROSS LINES !!!!!!!!!! Anywhere you are on that line the value will be the same. See page 26 (fig 2-7) Field values can change over time. See reference table for gradient formula Gradient = change in field value change in distance
What is the elevation of an area? • Where is the steepest gradient? • The steepest gradient occurs where the contour lines are drawn closest • together. • Where is the most gentle gradient? • The gentle gradient is where the contour lines are drawn farthest apart. • What is the gradient of the Brigitte River from the 200 foot contour line to • the contour line before the Brigitte River meets the Newburgh River? • Direction of Stream / River flow ? • Streams and rivers flow from an area of high elevation to an area of low • elevation. The contour lines bend towards the source (where it begins) • Profile a side view that shows changes in elevation. • Review book page 30 • study fig 2-9 on how to construct a profile.
TOPOGRAPHIC CONTOUR MAPS • See review book page 29 Callister Quadrangle • You must be able to answer the following !!!!! • Name of the location • Latitude /Longitude • Map Scale is used to measure distance • Map direction * = true north, MN = magnetic north • Symbols • Benchmark (BM “X”) is the recorded elevation of that area at the time of placement. • Depression – an area on the map that represents a hole or valley • symbol for depression “comb marks” • Romano Swamp and Lerose Sink • 8) Contour Interval – may or not be given describes how much the value of • each line changes