Download
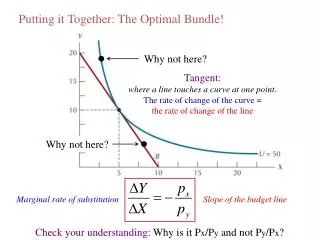
1 / 10
110 likes | 257 Vues
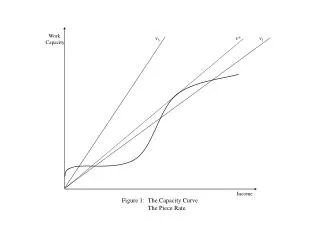
Work Capacity. v 3. v 1. v*. Income. Figure 1: The Capacity Curve The Piece Rate. Piece Rate. Aggregate Labor Supply. Figure 2: Labor Supply. Figure 3: Possible Equilibria. Employment Income. Figure 4: Effect of Non-Labor Income on the Capacity Curve. Land Owned.

E N D
Work Capacity v3 v1 v* Income Figure 1: The Capacity Curve The Piece Rate
Piece Rate Aggregate Labor Supply Figure 2: Labor Supply
Employment Income Figure 4: Effect of Non-Labor Income on the Capacity Curve
Land Owned Individuals Ranked By Land Owned Figure 5: Distribution of Land
Piece Rate Individuals Ranked By Land Owned Figure 6: Effective Reservation Wage
Piece Rate Piece Rate Individuals Ranked By Land Owned Aggregate Labor Supply/ Labor Demand Figure 7: Type of Equilibria
Income from Work y0 y1 y2 y3 Inherited Income Figure 1
Income from Work y2 y1 y0 Inherited Income y4 y5 y3 Figure 2
Income from Work Inherited Income Figure 3