Download
1 / 27
270 likes | 519 Vues
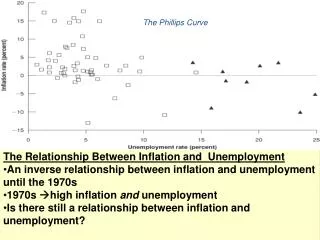
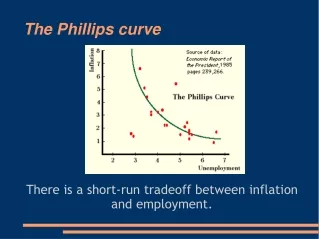
The Natural Rate of Unemployment and the Phillips Curve. The Natural Rate of Unemployment and the Phillips Curve. The Phillips curve, based on the data above, shows a negative relation between inflation and unemployment. Inflation Versus Unemployment in the United States, 1900-1960.

E N D
The Natural Rate of Unemploymentand the Phillips Curve • The Phillips curve, based on the data above, shows a negative relation between inflation and unemployment. Inflation Versus Unemployment in the United States, 1900-1960 During the period 1900-1960 in the United States, a low unemployment rate was typically associated with a high inflation rate, and a high unemployment rate was typically associated with a low or negative inflation rate.
Inflation, ExpectedInflation, and Unemployment 8-1 • The above equation is the aggregate supply relation derived in chapter 7. This relation can be rewritten to establish a relation between inflation, expected inflation, and the unemployment rate. • First, the function F, assumes the form: • Then, replace this function in the one above:
Inflation, ExpectedInflation, and Unemployment • The appendix to this chapter shows how to go from the equation above to the relation between inflation, expected inflation, and the unemployment rate below:
Inflation, ExpectedInflation, and Unemployment • According to this equation: • An increase in the expected inflation, e, leads to an increase in inflation, . • Given expected inflation e, an increase in the markup, , or an increase in the factors that affect wage determination, z, lead to an increase in inflation. • Given expected inflation, e, an increase in the unemployment rate, u, leads to a decrease in inflation, .
Inflation, ExpectedInflation, and Unemployment • When referring to inflation, expected inflation, or unemployment in a specific year, the equation above needs to include time indexes, as follows: • The variables, et, and ut refer to inflation, expected inflation and unemployment in year t. and z are assumed constant and don’t have time indexes.
The Phillips Curve 8-2 • If we set et = 0, then: • This is the negative relation between unemployment and inflation that Phillips found for the United Kingdom, and Slow and Samuelson found for the United States (or the original Phillips curve). • The wage-price spiral: Given Pet=Pt-1:
Mutations • The negative relation between unemployment and inflation held throughout the 1960s, but it vanished after that, for two reasons: • An increase in the price of oil, but more importantly, • A change in the way wage setters formed expectations due to a change in the behavior of the rate of inflation. • The inflation rate became consistently positive, and • Inflation became more persistent.
Mutations The steady decline in the U.S. unemployment rate throughout the 1960s was associated with a steady increase in the inflation rate. Inflation versus Unemploymentin the United States, 1948-1969
Mutations Beginning in 1970, the relation between the unemployment rate and the inflation rate disappeared in the United States. Inflation versus Unemploymentin the United States, 1970-2000
Mutations Since the 1960s, the U.S. inflation rate has been positive. Inflation has also become more persistent: A high inflation rate this year is more likely to be followed by a high inflation rate next year. U.S. Inflation, 1900-2000
The Formation of Expectations • Suppose expectations of inflation are formed according to • The parameter captures the effect of last year’s inflation rate, t-1, on this year’s expected inflation rate, et. • The value of steadily increased in the 1970s, from zero to one.
The Formation of Expectations • In the equation above, when equals zero, the relation between the inflation rate and the unemployment rate is: • When is positive, the inflation rate depends on both the unemployment rate and last year’s inflation rate: • When is positive, the inflation rate depends on both the unemployment rate and last year’s inflation rate:
The Formation of Expectations • When =1, the unemployment rate affects not the inflation rate, but the change in the expected inflation rate. • Since 1970, a clear negative relation emerged between the unemployment rate and the change in the inflation rate.
The Formation of Expectations • The line that best fits the scatter of points for the period 1970-2000 is: Change in Inflation versus Unemployment in the United States, 1970-2000 Since 1970, there has been a negative relation between the unemployment rate and the change in the inflation rate in the United States.
The Formation of Expectations • The original Phillips curve is: • The modified Phillips curve, also called the expectations-augmented Phillips curve, or the accelerationist Phillips curve, is:
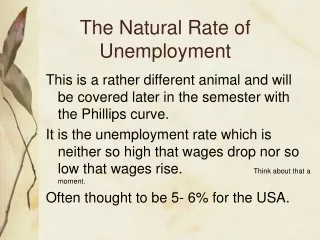
then, Back to the NaturalRate of Unemployment • Friedman and Phelps questioned the trade-off between unemployment and inflation. They argued that the unemployment rate could not be sustained below a certain level, a level they called the “natural rate of unemployment.” • The natural rate of unemployment is the unemployment rate such that the actual inflation rate is equal to the expected inflation rate.
Back to the NaturalRate of Unemployment • This is an important relation because it gives another way of thinking about the Phillips curve in terms of the actual and the natural unemployment rates, and the change in the inflation rate. then, then, Given Finally, assuming that et is well approximated by t-1, then:
Back to the NaturalRate of Unemployment • The equation above gives us another way of thinking about the natural rate of unemployment: • The non-accelerating-inflation rate of unemployment, (or NAIRU), is the rate of unemployment required to keep the inflation rate constant.
A Summary andMany Warnings 8-3 • The factors that affect the natural rate of unemployment above differ across countries. Therefore, there is no reason to expect all countries to have the same natural rate of unemployment. Variations in the Natural Rate of Unemployment Across Countries
Variations in the Natural Rateof Unemployment over Time • In the equation above, the terms and z may not be constant but, in fact, vary over time, leading to changes in the natural rate of unemployment. • The U.S. natural rate of unemployment has decreased to a level between 4% and 5% today. • A high unemployment rate does not necessarily reflect a high natural rate of unemployment. For example, • If inflation is decreasing fast, the actual rate of unemployment is far above the natural rate. • If inflation is stable, the actual and the natural rates of unemployment are roughly equal.
Variations in the Natural Rate of Unemployment Across Countries The Phillips curve relation between the change in the inflation rate and the unemployment rate has shifted to the right over time, suggesting a steady increase in the natural unemployment rate in the European Union since 1960. Change in Inflation Versus Unemployment—European Union, 1961-2000
High Inflation and thePhillips Curve Relation • The relation between unemployment and inflation is likely to change with the level and the persistence of inflation. • When inflation is high, it is also more variable. • The form of wage agreements also changes with the level of inflation. Wage indexation, a rule that automatically increases wages in line with inflation, becomes more prevalent when inflation is high.
High Inflation and thePhillips Curve Relation • Let denote the proportion of labor contracts that is indexed, and (1 ) the proportion that is not indexed.Then, becomes: • The proportion of contracts that is indexed responds to t, while the proportion that is not responds to et. • When =0, all wages are set on the basis of expected inflation (equal to last year’s inflation), then:
High Inflation and thePhillips Curve Relation • When is positive, • According to this equation, the higher the proportion of wage contracts that is indexed—the higher --the larger the effect of the unemployment rate on the change in inflation. • When is closer to 1, small changes in unemployment can lead to very large changes in inflation.
Deflation and thePhillips Curve Relation • Given the very high rate of unemployment during the Great Depression, we would have expected a large rate of deflation, but deflation was limited. • The reason for this may be that the Phillips curve relation may disappear or at least become weaker when the economy is close to zero inflation.
Key Terms • Phillips curve, • wage-price spiral, • modified, or expectations-augmented, or accelerationist Phillips curve, • nonaccelerating inflation rate of unemployment (NAIRU), • wage indexation,