Download
1 / 11
120 likes | 149 Vues
Explore the dynamics of the Phillips Curve, showcasing the interplay between inflation, unemployment, and policy decisions. Learn how adaptive expectations and inflation inertia influence economic outcomes. Gain insights on the short-run tradeoff and long-run implications.

E N D
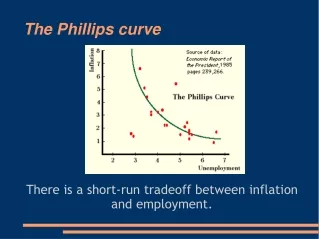
Inflation, Unemployment, and the Phillips Curve How the Phillips curve demonstrates the inflation-unemployment tradeoff that policy makers face.
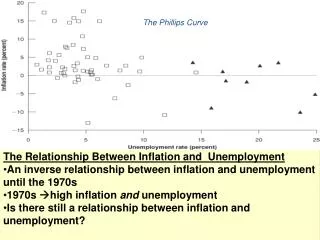
Building the Phillips Curve The Phillips curve states that inflation depends on expected inflation… the deviation of unemployment from the natural rate (cyclical unemployment)… and supply shocks.
Building the Phillips Curve The Phillips curve is derived from aggregate supply. First we add an exogenous supply shock term to the right hand side. Then we subtract last year’s price level P-1 from both sides. We can write inflation as π=(P–P-1) and expected inflation as πe=(Pe–P-1). Recall Okun’s law. Which states that deviation of output from its natural rate is inversely related to deviation of unemployment from its natural rate. By substituting we obtain the Phillips curve.
Building the Phillips Curve • So the Phillips curve and the short run aggregate supply curve essentially represent the same economic ideas.
Adaptive Expectations and Inflation Inertia • The Phillips curve shows the trade-off facing policy makers in terms of unemployment and inflation. • To make the Phillips curve more useful we need to say what causes expected inflation. A simple and plausible assumption might be that people form expectations about future inflation based on recent inflation. In this case, we can write the Phillips curve as... The first term in the Phillips curve implies that inflation has inertia and that inflation keeps going unless something acts to stop it. In essence we have inflation because we expect it and we expect it because we have it. which states that inflation depends on past inflation, cyclical unemployment, and a supply shock.
Inertia in AD-AS • In the AD-AS framework inflation inertia is characterized by persistent upward shifts of both AD and AS. P AS AD Q Most often the upward shifting aggregate demand curve is caused by persistent growth in the money supply. Aggregate supply shifts up because of expected inflation.
Inertia in AD-AS AS would stop shifting up. Suppose the central bank is pursuing an expansionary monetary policy causing AD to shift out. P If prices have been rising quickly, people will expect them to continue to do so. Because AS depends on expected inflation the AS curve will continue to shift upward. AS AD It will continue to shift upward until some event, such as a recession or a supply shock, changes inflation and thereby changes expectations of inflation. Y This would cause a recession. High unemployment would reduce inflation and expected inflation, causing inflation inertia to subside. If for example the central bank tightened the money supply, AD would shift back.
Two Causes of Rising and Falling Inflation The second term shows that cyclical unemployment exerts upward or downward pressure on inflation. Low unemployment pulls inflation up. This is called demand-pull inflation because high AD is the cause. The third term shows that inflation also rises and falls with supply shocks. An adverse supply shock would push production prices up. This type of inflation is called cost-push inflation.
The Short Run Tradeoff Between Inflation and Unemployment • While expected inflation and supply shocks are beyond the policy maker’s control, in the short-run the policy maker can use monetary or fiscal policy to shift the AD curve thus affecting output, unemployment, and inflation. • Aplot of the Phillips curve shows the short-run tradeoff between inflation and unemployment. π β 1 πe+v u un A policymaker who controls AD can choose a combination of inflation and unemployment on this short-run Phillips curve.
The Short Run Tradeoff Between Inflation and Unemployment • Because people adjust their expectations of inflation over time, the tradeoff between inflation and unemployment holds only in the short run. • In the long run, expectations adapt, inflation returns to whatever rate the policymaker has chosen, and unemployment returns to the natural rate. π β 1 πe+v u un An increase in expected inflation causes the curve to shift upward. So that at any unemployment rate there will be higher inflation.
Conclusions • In this section we discussed the Phillips curve. The Phillips curve demonstrates the inflation-unemployment tradeoff that policy makers face.