Download

1 / 24
260 likes | 602 Vues
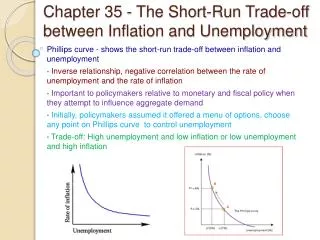
The Phillips Curve — Is There a Trade-off Between Inflation and Unemployment?. 6. 7. 7. 5. Early Views About the Phillips Curve. Phillips Curve: Early Views. Phillips Curve : A curve that indicates the relationship between the rate of inflation and rate of unemployment.

E N D
The Phillips Curve— Is There a Trade-off Between Inflation and Unemployment? 6 7 7 5
Early Views About the Phillips Curve
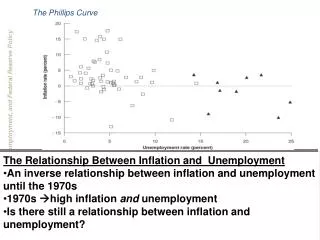
Phillips Curve: Early Views • Phillips Curve:A curve that indicates the relationship between the rate of inflation and rate of unemployment. • During the 1960s, most economists believed higher rates of inflation would permanently reduce the rate of unemployment. • This led to the the expansionary macroeconomic policies of the 1970s. • The stability of the inflation-unemployment relationship proved to be an illusion. • During 1969-1975, as inflation rose from 3% to double-digits levels, unemployment rose from less than 4% to more than 8%. • As high levels of inflation continued in the 1970s, so did high rates of unemployment.
68 Phillips curve 57 66 55 56 65 60 67 62 58 59 63 64 54 61 The Phillips Curve Before the 1970s Inflation rate(% change in GDPprice deflator) 4 3 2 1 Unemploymentrate (%) 3 4 5 6 7 • This exhibit is taken from the 1969 Economic Report of the President. Dots represent the inflation and unemployment rate for the respective years. The report states that the chart “reveals a fairly close association of more rapid price increases with lower rates of unemployment.”
Expectations and the Phillips Curve • The error of early Phillips Curve proponents was their failure to consider expectations. • Integration of expectations into the Phillips curve analysis indicates that any trade-off between inflation and unemployment will be short-lived. • An unanticipated shift to expansionary policy may temporarily reduce unemployment, but when decision makers come to anticipate the higher rate of inflation, unemployment will return to its natural rate. • Even high rates of inflation will fail to reduce unemployment once they are anticipated by decision makers.
PC1 (stable prices anticipated ) B B AD2 The AD/AS model, Adaptive Expectations and the Phillips Curve • Begin at full-employment output – YF ,(pt A inboth frames). • With adaptive expectations, a shift to a more expansionary policy will increase prices, expand output beyond full-employment, and reduce the unemployment rate below its natural level (move to pt B in both frames). LRAS PriceLevel Rate ofinflation SRAS1 8 % P104 A P100 4 % AD1 Rate of unemployment Goods & Services (real GDP) A YF Y2 1% 3% 5% 7%
Long-run Phillips curve(natural rate of unemployment) SRAS3 SRAS2 PC2 PC1 C (4% inflation (stable prices anticipated ) anticipated ) AD3 C The AD/AS model, Adaptive Expectations and the Phillips Curve • Decision makers eventually anticipate the rising prices and incorporate them into their decision making (shifting SRAS1 to SRAS2, returning output to the full-employment level YF and unemployment to the natural rate (pt C in both frames). • If inflationary policy persists, and decision makers anticipate it, AD & SRAS shift upward without increases in output & employment (leading to a vertical long run Phillips curve). LRAS PriceLevel Rate ofinflation SRAS1 P112 P108 8 % P104 B A P100 B 4 % AD2 AD1 Rate of unemployment Goods & Services (real GDP) A YF Y2 1% 3% 5% 7%
D 4% inflationanticipated Shifts of the Phillips Curve Rate of inflation (%) PC2 8 % C 4 % Rate of unemployment (%) 1 % 3 % 5 % 7 % 9 % • Pt. C illustrates an economy experiencing 4% inflation that was anticipated by decision makers, and because the inflation was anticipated, the natural rate of unemployment is present. • With adaptive expectations, demand stimulus policies that result in a still higher rate of inflation (like 8%) would once again temporarily reduce the unemployment rate below its long-run, normal rate (moving from pt. C to pt. D along PC2).
Long-run Phillips curve (natural rate of unemployment) PC3 E 8% inflationanticipated 4% inflationanticipated F Shifts of the Phillips Curve Rate of inflation (%) PC2 8 % D C 4 % Rate of unemployment (%) 1 % 3 % 5 % 7 % 9 % • After a time, decision makers come to anticipate the higher inflation rate, and the short-run Phillips curve shifts still further to the right to PC3 (a movement from pt. D to pt. E). • Once the higher rate is anticipated, if macro planners try to decelerate the inflation, unemployment will temporarily rise above its long-run natural rate (like from pt. E to pt. F).
Expectations and the Modern View of the Phillips Curve
Expectations and the Modern View of the Phillips Curve • There is no permanent tradeoff between inflation and unemployment. • Demand stimulus will lead to inflation without permanently reducing unemployment below the natural rate. • Like LRAS, the Long-Run Phillips Curve is vertical at the natural rate of unemployment. • When inflation is greater than anticipated, unemployment falls below the natural rate. • When the inflation rate is steady — neither rising nor falling — the actual rate of unemployment will equal the economy’s natural rate of unemployment.
Persons under-estimate inflation Persons correctly forecast inflation Persons over-estimate inflation Natural rate Modern Expectational Phillips Curve Actual minus expectedrate of inflation PC 10 % 5 % 0 % - 5 % Unemploymentrate -10 % • The modern view stresses that it is the actual rate of inflation relative to the expected rate that matters. • When the actual rate is greater than (less than) the expected rate, unemployment will be less than (greater than) its natural rate.
Expectations, Inflation and Unemployment: The Empirical Evidence
81 75 80 74 79 78 77 73 82 76 69 71 PC3 (1974-1983 ) 70 68 72 83 66 PC2 67 (1970-1973, 65 62 61 PC1 64 (1961-1969, 63 Real World Shifts in the Phillips Curve 10 % Inflation rate(change in GDP price deflator) 8 % 6 % 4 % 2 % 0 % Unemploymentrate 3 % 4 % 5 % 6 % 7 % 8 % 9 % 10 % Source: Economic Report of the President, 2001 • Nearly 20 years of low inflation followed the second world war, so the shift toward expansionary policies and rising prices in the mid-1960s caught people by surprise, temporarily reducing the unemployment rate. • As people came to expect inflation, the PC shifted upward. More inflation during 1974-1983 led to a still larger shift.
81 75 80 74 79 78 77 73 82 76 69 71 PC3 (1974-1983 ) 70 68 91 89 72 90 83 84 66 88 85 92 PC2 87 67 (1970-1973, 93 95 86 00 1984-1993) 94 65 62 97 96 99 61 PC1 64 (1961-1969, 63 98 1994-2000) Real World Shifts in the Phillips Curve 10 % Inflation rate(change in GDP price deflator) 8 % 6 % 4 % 2 % 0 % Unemploymentrate 3 % 4 % 5 % 6 % 7 % 8 % 9 % 10 % Source: Economic Report of the President, 2001 • Monetary restraint in 1984-1993 unexpectedly decelerated inflation, raising unemployment until people adjusted their inflationary expectations downward. • Low rates of inflation were maintained, reducing inflationary expectations, and the 1994-2000 Phillips curve appears to be in a position similar to the ’60s.
Unemployment rate Percent change in inflation rate Changes in Inflation & Unemployment 10 % 8 % 6 % 4 % 2 % 0 % -2 % -4 % -6 % 1971 1975 1980 1985 1990 1995 2000 Source: Economic Report of the President, 2001. • Consider the relationship between changes in the inflation rate and the rate of unemployment. • Note how the sharp reductions in the rate of inflation during 1975, 1981-1982, and 1991 were associated with recession and substantial increases in the unemployment rate. • In contrast, the low and steady inflation rates since 1992 have led to low rates of unemployment.
The Phillips Curve and Macro-policy
The Phillips Curve and Macro-policy • The early view that there was a trade-off between inflation and unemployment helped promote the more expansionary macroeconomic policy of the 1970s. • Rejection of this view during the 1980s created an environment more conducive to price stability. • In turn, the increase in price level stability contributed to the lower unemployment rates of the 1990s. • In the long-run, expansionary policy in pursuit of lower unemployment leads to higher rates of both inflation and unemployment.
7.9 % 7.2 % 6.4 % 5.3 % 5.1 % 4.8 % 4.8 % 3.3 % 2.2 % 1.8 % Inflation and Unemployment 1959-69 1970-73 1974-82 1984-95 1996-00 1959–69 1970–73 1974–82 1984–95 1996–00 (a) Average rate of Inflation (b) Average rate of unemployment Source: Economic Report of the President, 2001. • When more expansionary policies were pursued during both the ’70-’73 and ’74-’82 periods, higher rates of both inflation and unemployment occurred. • In contrast, lower rates of unemployment have accompanied the lower inflation rates of the more recent periods.
The Phillips Curve and Macro-policy • There are two important lessons to be learned from the Phillips curve era: • Expansionary macro policy will not reduce unemployment, at least not for long. • Macro policy, particularly monetary policy, can achieve persistently low rates of inflation, which will help promote low rates of unemployment. • There is no conflict between low rates of inflation and low rates of unemployment.
Questions for Thought: 1. Why did many economists during the 1960s and 1970s wrongly believe that expansionary macroeconomic policy resulting in inflation would reduce the rate of unemployment? 2. Are the following statements true or false? a. Decision makers are likely to underestimate sharp abrupt reductions in the inflation rate. b. Demand stimulus policies that lead to a higher than anticipated inflation will temporarily lead to unemployment below the natural rate. c. Once decision makers anticipate a rate of inflation, it will fail to stimulate real output.
Questions for Thought: 3. How would you expect the actual unemployment to compare with the natural rate of unemployment in the following cases? a. Prices are stable and have been stable for the last four years. b. The inflation rate has been steady at about 3%, over the last 6 years. c. For the last 6 months, expansionary policies have caused an unexpected increase in the inflation rate from 3 to 7%. d. The rate of inflation has unexpectedly fallen from 7 to 2%.
Questions for Thought: 4. What happens to real wages, the job-search time of workers, and the unemployment rate when there is an unanticipated increase in the rate of inflation? What will happen when the higher rate of inflation is anticipated? 5. In recent years, monetary policy has sought to keep the inflation rate low and steady. Could lower rates of unemployment and higher rates of real output be achieved if monetary policy were more expansionary?