Download
1 / 26
260 likes | 388 Vues
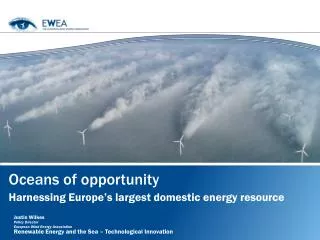
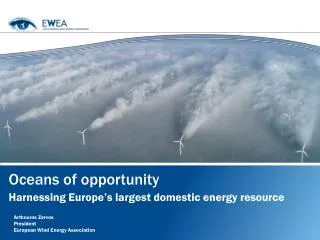
Oceans of opportunity. Harnessing Europe’s largest domestic energy resource. Justin Wilkes Head of Regulatory Affairs European Wind Energy Association. European Offshore Wind Conference 2009 16 September 2009. Outline. The offshore wind power market – current status

E N D
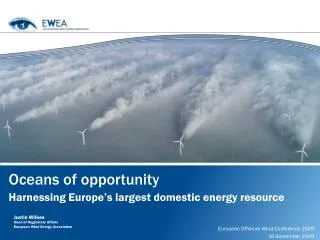
Oceans of opportunity Harnessing Europe’s largest domestic energy resource Justin WilkesHead of Regulatory Affairs European Wind Energy Association European Offshore Wind Conference 2009 16 September 2009
Outline • The offshore wind power market • – current status • – future developments • National policies and programmes
Outline • The offshore wind power market • – current status • – future developments • National policies and programmes
Offshore – current status End 2008: 1.5 GW offshore – 8 EU countries
Global cumulative wind power capacity 1990-2007 (MW) 2008 and 2009: steady as she goes • 2008: • 366 MW annual installed offshore capacity • 1,471 MW cumulative installed offshore capacity • 2009: • 420 MW annual installed offshore capacity • 2,000 MW cumulative installed offshore capacity
Outline • The offshore wind power market • – current status • – future developments • National policies and programmes
Global cumulative wind power capacity 1990-2007 (MW) Offshore wind energy market in the EU in 2010 • Annual installations of 1,100 MW • Cumulative installed capacity of 3,000 MW • Electricity production of 11 TWh • Meeting 0.3% of total EU electricity demand • Avoiding 7 Mt of CO² annually • Annual investments in wind turbines of €2.5 billion
Global cumulative wind power capacity 1990-2007 (MW) 2011 – 2020: steady growth of offshore market Offshore wind energy annual and cumulative installations 2011-2020 (MW) • 2011: annual installations of 1.5 GW • 2020: annual installations of 6.9 GW • 2020: cumulative installations of 40 GW Source: EWEA 2009
Global cumulative wind power capacity 1990-2007 (MW) Offshore market growth to follow the onshore pattern Historical onshore growth 1992-2004 compared to EWEA‘s offshore projection 2008-2020 (MW) • Onshore market growth: 32% • Offshore market growth: 28% Source: EWEA 2009
Global cumulative wind power capacity 1990-2007 (MW) 2021 - 2030: steady growth of offshore market Offshore wind energy annual and cumulative installations 2021-2030 (MW) • 2021: annual installations of 7.7 GW • 2030: annual installtions of 13.6 GW • 2030: cumulative installations of 150 GW Source: EWEA 2009
Global cumulative wind power capacity 1990-2007 (MW) 100 GW and counting • EWEA has identified proposals for over 100 GW of offshore wind projects in European waters: • This would meet 10% of EU electricity demand • This would avoid 200Mt of CO² annually • 100+ GW shows the significant level of developer interest • EWEA prediction: 40 GW by 2020 • 150 GW by 2030
Outline • The offshore wind power market • – current status • – future developments • National policies and programmes
Global cumulative wind power capacity 1990-2007 (MW) Country breakdown Ireland • Online: 25.2 MW • Current pipeline: 3,755 MW • Total: 3,780.2 MW Source: EWEA 2009
Global cumulative wind power capacity 1990-2007 (MW) Country breakdown United Kingdom • Online: 597.8 MW • Under construction: 1,246 MW • Current pipeline: 13,861 MW • R1, R2, STW + misc total: 15,704.8 MW • UK Round 3: 25,500 MW Source: EWEA 2009
Global cumulative wind power capacity 1990-2007 (MW) Country breakdown The Netherlands • 2020 target : 6,000 MW • Online: 246.8 MW • Under construction: 200 MW • Current pipeline: 4,615 MW • Total: 5,061.8 MW Source: EWEA 2009
Global cumulative wind power capacity 1990-2007 (MW) Country breakdown Belgium • 2020 target: 2,000 MW • Online: 30 MW • Under construction: 600 MW • Current pipeline: 1,114 MW • Total: 1,744 MW Source: EWEA 2009
Global cumulative wind power capacity 1990-2007 (MW) Country breakdown France Atlantic • 2020 target: 6,000 MW • Under construction: 105 MW • Current pipeline: >4,925.5 MW • Total: >5,030.5 MW Mediterranean Source: EWEA 2009
Global cumulative wind power capacity 1990-2007 (MW) Country breakdown Germany • Objective 2025: 25,000 MW • Online: 12 MW (all near shore) • Under construction: 1,002.5 MW • Pipeline: 23,708 MW • Total: 25,322.5 MW Source: EWEA 2009
Global cumulative wind power capacity 1990-2007 (MW) Country breakdown Denmark • Online: 409.15 MW • Under construction: 459.2 MW • Current pipeline: > 1,218 MW • Total: > 2,086.35 MW Source: EWEA 2009
Global cumulative wind power capacity 1990-2007 (MW) Country breakdown Sweden • Online: 133.2 MW • Under construction: 30 MW • Current pipeline: 10,850 MW • Total: 11,013.2 MW Source: EWEA 2009
Global cumulative wind power capacity 1990-2007 (MW) Country breakdown Finland • Objective 2020: 1,000 MW • Online: 24 MW • Current pipeline: 1,306 MW • Total: 1,330 MW Source: EWEA 2009
Global cumulative wind power capacity 1990-2007 (MW) Country breakdown Norway • Online: 2.3 MW • Current pipeline: 11,296 MW • Total: 11,298.3 MW Source: EWEA 2009
Country breakdown Global cumulative wind power capacity Spain & PortugalW) • Online: 0 MW • Current pipeline: • Spain: 4,965 MW • Portugal: 301 MW Source: EWEA 2009
Country breakdown • Italy & Malta (Croatia & Albania) • Online: 0 MW • Under construction: 83 MW • Current pipeline: 8,886.8 MW • Total: 8,969.8 MW Source: EWEA 2009
Thank you very much for your attention www.ewea.org/offshore RENEWABLE ENERGY HOUSE 63-65 RUE D’ARLON B-1040 BRUSSELS T: +32 2 546 1940 F: +32 2 546 1944 E: ewea@ewea.org