Methylation Levels of CYP24A1 Promoter in Lung Samples
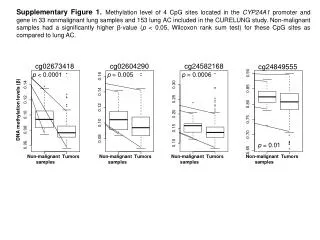
This study compares DNA methylation levels in 33 nonmalignant lung samples and 153 lung adenocarcinoma (AC) samples from the CURELUNG study. Nonmalignant samples showed significantly higher methylation levels in CpG sites of the CYP24A1 promoter compared to lung AC samples. Supplementary Figure 1 visualizes the methylation differences. Supplementary Figure 2 illustrates CYP24A1 expression in lung cancer cell lines treated with 5-Aza and TSA followed by 1,25-D3, with qRT-PCR and protein expression data.

Methylation Levels of CYP24A1 Promoter in Lung Samples
E N D
Presentation Transcript
Supplementary Figure 1.Methylation level of 4 CpG sites located in the CYP24A1 promoter and gene in 33 nonmalignant lung samples and 153 lung AC included in the CURELUNG study. Non-malignant samples had a significantly higher β-value (p < 0.05, Wilcoxon rank sum test) for these CpG sites as compared to lung AC. cg02673418 cg02604290 cg24582168 cg24849555 p < 0.0001 p = 0.005 p = 0.0006 DNA methylation levels (β) p = 0.01 Non-malignant Tumors samples Non-malignant Tumors samples Non-malignant Tumors samples Non-malignant Tumors samples
Supplementary Figure 2. (A) Quantitative RT-PCR of CYP24A1 expression in H460 and SK-LU-1 cells treated with increasing concentrations of 5-Aza followed by 100 nM of 1a,25-dihydroxyvitamin D3 (1,25-D3). (B) Quantitative RT-PCR of CYP24A1 expression in H460 and SK-LU-1 cells treated with increasing concentrations of TSA followed by 100 nM of 1,25-D3. Barplots and error bars represent mean and standard deviation of triplicate data points. (C) Basal protein expression of DNMT1 and DNMT3A in A549, NCI-H460 and SK-LU-1 cells. Glyceraldehyde 3-phosphate dehydrogenase (GAPDH) was used as loading control. A B 5-Aza (mM) 1,25-D3 1,25-D3 C DNMT1 DNMT3A TSA (nM) GAPDH H460 A549 SKLU-1