Download
1 / 37
370 likes | 517 Vues
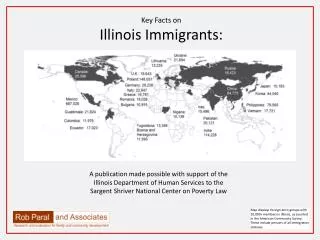
Key Facts on Illinois Immigrants:. A publication made possible with support of the Illinois Department of Human Services to the Sargent Shriver National Center on Poverty Law .

E N D
Key Facts on Illinois Immigrants: A publication made possible with support of the Illinois Department of Human Services to the Sargent Shriver National Center on Poverty Law Map displays foreign-born groups with 10,000+ members in Illinois, as counted in the American Community Survey. These include persons of all immigration statuses.
Table of Contents Page Population Trends Number of Immigrants 4 Countries of Origin 7 Place of Residence 8 Key Measures of Integration 10 Naturalization 11 Income 12 Educational Attainment 13 Growth of Immigrant Population Place of Residence 14 Port-of-Entry 25 New Immigrant Neighborhoods 27 Impact on Legislative Districts Illinois Senate 32 Illinois House of Representatives 34
Foreign-Born Population In Illinois There are 1.7 million immigrants in the state of Illinois. The state has the fifth largest foreign-born population in the nation. Foreign-born persons are nearly 14 percent or more than one in seven Illinois residents.
Immigration over Time The number of immigrants in Illinois is at an all-time high, and has risen steadily since the 1960s, when federal immigration laws were substantially revised. The foreign-born percent of the Illinois population has also been rising since the 1960s, yet immigrants are a much smaller share of the state’s population then they were a century ago. Sources: Decennial censuses; “2009” refers to 2005-2009 American Community Survey
Growth of Foreign Born in Illinois Immigration has slowed significantly in Illinois. The foreign-born population grew by almost 61 percent during the 1990s, but between 2000 and the 2005-2009 period the population rose only 12 percent. Sources: Decennial censuses; “2009” refers to 2005-2009 American Community Survey
Countries of Origin Immigrants from Mexico comprise the largest portion of all foreign-born groups in Illinois, at 688,000 persons in 2005-2009. Of large immigrant groups, India and Mexico represent the fastest growing populations.
Residence of Immigrants in Illinois The collar counties are experiencing the fastest growth in immigrant population. The foreign born have risen in number by more than 200 percent in Kane, Lake, McHenry and Will counties since 1990. The collar counties are home to 483,000 immigrants. In the city of Chicago, however, the number of foreign born declined by more than 5% since the year 2000. Click Here For A More Detailed Look at Immigrants by Counties Source: Decennial censuses; “2009” refers to 2005-2009 American Community Survey
The Rise of the Suburbs The graph below illustrates the declining numbers of immigrants in Chicago, the flattening of immigrant growth in suburban Cook, and the rising share of regional immigrants in the collar counties. Source: Decennial censuses; “2009” refers to 2005-2009 American Community Survey
Key Measures of Integration With its long history of immigration, a key question for Illinois is the extent to which immigrant populations are integrating into society. Three key measures of immigrant integration are citizenship, income and education.
Naturalization Rates Naturalization is the voluntary process by which legal immigrants become U.S. citizens. The percent of immigrants who are naturalized is an important indicator of immigrant integration. Naturalization rates of Illinois immigrants have risen since the year 2000, after a decline during the 1990s.* About 44 percent of immigrants are U.S. citizens. Naturalization rates are highest among long-established groups from Europe, and lowest among the Mexican population. *Naturalization rates fell in part because the 1990s were a period with high levels of new immigrant arrivals, both documented and undocumented.
Poverty Rates Poverty among immigrants in Illinois has declined slightly since 1990. About 12.9 percent of immigrants are below the poverty level. Among individual groups, current poverty rates are highest among persons from Mexico (17.3%), the Ukraine (14.6%) and Korea (13.2%). Poverty rates among natives have risen since 1990, from 11.7 percent in that year to 11.9 percent in 2005-2009.
Educational Attainment Educational levels of Illinois immigrants have risen steadily in the last two decades. In 1990 about 42 percent of immigrants did not have a high school degree, but by 2005-2009 that number had fallen to 30 percent. Similarly, the percent of the foreign born with a bachelors degree rose from 21 to 28 percent between 1990 and 2007. Source: IPUMS: “2007” is average of 2006-08 period
Percent Foreign Born in Metro Chicago Places: 2000 Click here for an interactive, web-based map.
Percent Foreign Born in Metro Chicago Places: 2005/2009 Click here for an interactive, web-based map.
The following maps use American Community Survey data on immigrants by census tracts to provide a deeper understanding of where the foreign born live and their importance within neighborhoods and other local areas. Impact of Immigration on Neighborhoods Click Here For A More Detailed Look at Immigrants by Municipalities* *Large file, may take time to load.
0% - 6% 6.1% - 15% 15.1% - 23% 23.1% - 100% Percent Foreign Born in Metro Chicago Census Tracts: 2005/2009 Click here for an interactive, web-based map.
0 - 750 751 - 1,500 1,501- 3,000 3,001 - 8,300 Number of Foreign Born in Metro Chicago Census Tracts: 2005/2009 Click here for an interactive, web-based map.
0% - 15% 15.1% - 30% 30.1% - 60% 60.1% - 100% Percent of Immigrants as of 2005-2009 Who Had Arrived Since Year 2000 Click here for an interactive, web-based map.
1990 2000 2005-2009 • These maps tell another story of metro Chicago immigration. Each dot represents the top 100 census tracts in terms of recent immigrants. As may be seen, new immigrants to metro Chicago increasingly arrive in the suburbs and in an increasingly dispersed set of neighborhoods in the region. • Map details are : • 1990: top 100 tracts in number of immigrants who arrived in 1985-1990 • 2000: top 100 tracts in number of immigrants who arrived in 1995-2000 • 2005-2009: top 100 tracts in number of immigrants who arrived since 2000
Top 10 Census Tracts of New Immigrant Arrivals to Metro Chicago This map displays the top ten census tracts in 2005-2009 in number of recent arrivals to the U.S., i.e., immigrants who came to the U.S. since 2000. These port-of-entry areas are significant for where they are – on the North Side of Chicago and in the northern Cook County suburbs – and where they are not – they do not include traditional immigrant neighborhoods on Chicago’s South Side such as the Lower West Side or South Lawndale. New arrivals are immigrants who came to the U.S. since the year 2000. Source: 2005-2009 American Community Survey
What Is the Impact of Immigrants in State Legislative Districts?
Impact in Legislative Districts As immigrant communities move to the suburbs they play an increasing role in suburban legislative districts. The maps below highlight this movement of immigrants to districts in DuPage and Kane counties. Note: Legislative district maps and elected officials as of February 2011.
Foreign Born Population In Illinois Senate Districts 2000 2009 Source: 2005-2009 American Community Survey
Illinois State Senate, Foreign-Born Population Click Here for a More Detailed Look at Senate Districts Source: 2005-2009 American Community Survey
Illinois State Senate, Naturalized U.S. Citizens Click Here for a More Detailed Look at Senate Districts Source: 2005-2009 American Community Survey
Illinois State Representatives, Foreign-Born Population Click Here for a More Detailed Look at House Districts Source: 2005-2009 American Community Survey
Illinois State Representatives, Foreign-Born Population, cont. Click Here for a More Detailed Look at House Districts Source: 2005-2009 American Community Survey
Illinois State Representatives, Naturalized U.S. Citizens Click Here for a More Detailed Look at House Districts Source: 2005-2009 American Community Survey
Illinois State Representatives, Naturalized U.S. Citizens, cont. Click Here for a More Detailed Look at House Districts Source: 2005-2009 American Community Survey