Download

1 / 35
360 likes | 617 Vues
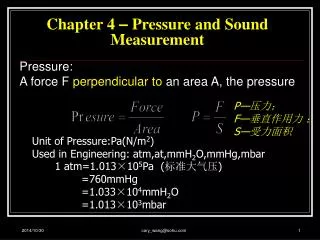
SOUND PRESSURE, POWER AND LOUDNESS. MUSICAL ACOUSTICS. Science of Sound Chapter 6. DECIBEL SCALES. Decibel scales are used to compare two quantities (levels) Δ L = L 2 - L 1 = 10 log W 2 /W 1 or to compare a level with a reference level

E N D
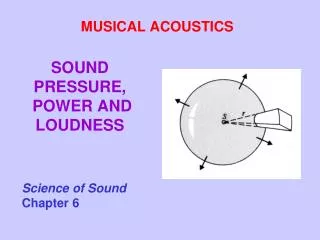
SOUND PRESSURE, POWER AND LOUDNESS MUSICAL ACOUSTICS Science of Sound Chapter 6
DECIBEL SCALES Decibel scales are used to compare two quantities (levels) ΔL = L 2 - L 1 = 10 log W2/W1 or to compare a level with a reference level LW = 10 log W/W0 LW = Sound power level (in dB) W = Sound power (in W/m2) Example: What is the sound power level of a loudspeaker with W = 0.1 W? LW= 10 log 0.1/10-12 = 110 dB What is the dB gain of an amplifier when the power gain is 400? 400 = 2x2x100, so the dB gain is 3+3+20 = 26 dB 4 The decibel scale (Tracks 8,9,10)
Sound intensity level (LI or SIL) LI = 10 log I/I0 where I0 = 10 -12 W/m2 Example: What is LI when I = 10-4 W/m2 ? LI = 10 log 10-4/10-12 = 10(8) = 80 dB
FREE FIELD I = W/4πr2 at r = 1 m: LI = 10 log I/10-12 = 10 log W/10-12 – 10 log 4p = LW - 11 )
HEMISPHERICALFIELD I = W/2pr2 at r = l m LI = LW - 8 Note that the intensity I 1/r2 for both free and hemispherical fields; therefore, LI decreases 6 dB for each doubling of distance 4 Decibel scale (free-field speech) Track 11
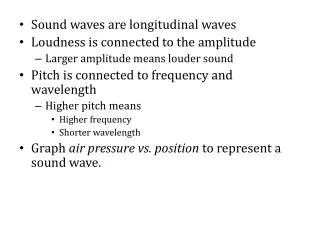
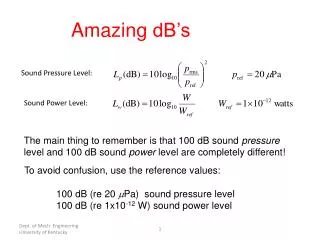
SOUND PRESSURE LEVEL Our ears respond to extremely small pressure fluctuations p Intensity of a sound wave is proportional to the sound Pressure squared: I = p2 /ρcρ = density ρc ≈ 400 c = speed of sound We define sound pressure level: Lp = 20 log p/p0 p0 = 2 x 10⁻⁵ Pa (or N/m2) (or SPL)
MULTIPLE SOURCES Example:Two uncorrelated sources of 80 dB each will produce a sound level of 83dB (Not 160 dB)
MULTIPLE SOURCES What we really want to add are mean-square average pressures (average values of p2) This is equivalent to adding intensities Example: 3 sources of 50 dB each Lp = 10 log [(P12+P22+P32)/P02] = 10 log (I1 + I2 + I3)/ I0) = 10 log I1/I0 + 10 log 3 = 50 + 4.8 = 54.8 dB
Sound pressure level is measured with a sound level meter (SLM) Sound intensity level is more difficult to measure, and it requires more than one microphone In a free field, however, LI ≈ LP SOUND PRESSURE and INTENSITY
Loudness • Pitch • Timbre • Duration FOUR ATTRIBUTES USED TO DESCRIBE A SOUND: EACH OF THESE DEPENDS ON ONE OR MORE PHYSICAL PARAMETERS THAT CAN BE MEASURED: • Sound pressure • Frequency • Spectrum • Duration (measured) • Envelope Relating the SUBJECTIVE QUALITIES to the PHYSICAL PARAMETERS that we can MEASURE OBJECTIVELY Is an important problem in PSYCHOACOUSTICS
DEPENDENCE OF SUBJECTIVE QUALITIES OF SOUND ON PHYSICAL PARAMETERS
LOUDNESS LEVEL Contours of equal loudness are labeled phons At 1000 Hz, Loudness Level = Lp
PLOT YOUR OWN FREQUENCY RESPONSE ASSIGNMENT: Plot your own frequency response curves by using www.phys.unsw.edu.au/~jw/hearing.html
HOW DOES LOUDNESS DEPEND ON FREQUENCY? Don’t confuse loudness level Expressed in phons) with loudness (expressed in sons)
7 Loudness scaling (Tracks 19-20) The reference tone plus the strongest and weakest noise samples Twenty noise samples Write down the loudness on a scale where the reference sound is 100
7 Loudness scaling (Tracks 19-20) The reference tone plus the strongest and weakest noise samples Twenty noise samples Write down the loudness on a scale where the reference sound is 100 Test tone levels were +15,-5,-20, 0, -10,+20,+5,+10,-15, 0,-10,+15,+20, -5,+10,-15,-5,-20,+5,+15 dB
LOUDNESS SCALING 7 Loudness scaling (Track 19,20)
LOUDNESS OF COMPLEX TONES Loudness depends mainly on SOUND PRESSURE. but it also depends on FREQUENCY, SPECTRUM and DURATION
DEPENDENCE OF LOUDNESS ON BANDWIDTHCRITICAL BANDS • Critical bands by loudness comparison Track 7 The bandwidth of the test band is increased each time while the amplitude is decreased to keep the power constant. Note when the loudness begins to increase.
DEPENDENCE OF LOUDNESS ON BANDWIDTHCRITICAL BANDS 3 Critical bands by loudness comparison Track 7
Count how many steps of the test tone can be heard in each case 9 Asymmetry of masking (Track 22)
Count how many steps of the test tone can be heard in each case Mpst people hear more steps when the masker is higher in frequency 9 Asymmetry of masking (Track 22) 10 Backward an d forward masking (Tracks 23-25)
HOW DOES LOUDNESS DEPEND ON DURATION? 8 Temporal integration (Track 21) Noise bands of 1000,300,100, 30,10 , 3 and 1 ms are presented in 8 decreasing steps. Count the number you hear for each duration.
LOUDNESS RECRUITMENT UNUSUALLY RAPID GROWTH OF LOUDNESS ABOVE A CERTAIN THRESHOLD GENERALLY ASSOCIATED WITH HEARING LOSS, BUT NORMAL LISTENERSEXPERIENCE IT FOR TONES OF VERY HIGH OR VERY LOW FREQUENCY
MONAURAL vs BINAURAL LOUDNESS FOR SOFT SOUNDS (~20dB) BINAURAL LOUDNESS EXCEEDS MONAURAL LOUDNESS BY A FACTOR OF 2 (CORRESPONDS TO ΔL = 8dB) FOR LOUD SOUNDS (~80dB) BINAURAL LOUDNESS EXCEEDS MONAURAL LOUDNESS BY A FACTOR ~/.4 (CORRESPONDS TO ΔL = 6dB) Zwicker & Fastl (1990)
INTENSITY DISCRIMINATION AND CODING AT LOW LEVELS, INTENSITY CHANGES CAN BE SIGNALLED BOTH BY CHANGES IN FIRING RATES OF NEURONS AT THE CENTER OF THE EXCITATION PATTERN AND BY THE SPREADING OF THE EXCITATION PATTERN (TO INCLUDE MORE NEURONS) AT HIGH LEVELS, MOST NEURONS AT THE CENTER OF THE EXCITATION PATTERN ARE SATURATED, BUT INTENSITY CHANGES ARE SIGNALLED BY CHANGES IN FIRING RATES AT THE EDGES. AN INCREASE IN LEVEL ALSO MAY BE SIGNALLED BY INCREASED PHASE LOCKING TO THE TONE WHICH RESULTS IN TEMPORAL REGULARITY OF NEURAL FIRINGS
ASSIGNMENT FOR WEDESDAY Exercises 2,4,5,6 (p. 119) Plot loudness scaling curve (log of loudness rating vs sound level) Re-read Chapter 7