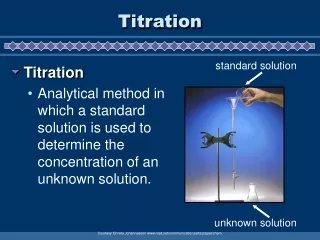
Determining Optimal Dilution of SpotQC in Titration Experiment with Microarrays
This experiment investigated the ideal dilution of SpotQC using eight distinct organism-specific microarrays, hybridized at six different concentrations (2 µM, 1 µM, 0.5 µM, 25 µM, 1 µM, and 0.1 µM). The microarrays tested included strains like A. fumigatus, B. anthracis, L. monocytogenes, and others. All slides were scanned under consistent conditions, and Log2 signal intensities were computed using Spotfinder. Data visualization included box plots depicting variations in signal intensities across different concentrations and print lots to establish quality control standards.

Determining Optimal Dilution of SpotQC in Titration Experiment with Microarrays
E N D
Presentation Transcript
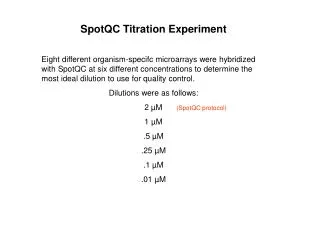
SpotQC Titration Experiment • Eight different organism-specifc microarrays were hybridized with SpotQC at six different concentrations to determine the most ideal dilution to use for quality control. • Dilutions were as follows: • 2 µM (SpotQC protocol) • 1 µM • .5 µM • .25 µM • .1 µM • .01 µM
SpotQC Titration Experiment • Tested 8 different organism print lots: • QAF01122005A A. fumigatus • QBA12012004A B. Anthracis • QLM11222004A L. monocytogenes • 3QSA12292004A S. aureus • QSM01042005A S. mutans • 2QSP11012004A S. pneumoniae • QVC12032004A V. cholera • QYP12102004A Y. pestis
SpotQC Titration Experiment • Print plates for each print lot varied in age: • Date Created: • QAF01122005A 7/30/04 • QBA12012004A 3/31/04 • QLM11222004A 5/20/04 • 3QSA12292004A 12/22/04 • QSM01042005A 4/8/04 (refreshed 12/3/04) • 2QSP11012004A 4/8/04 • QVC12032004A 3/11/04 • QYP12102004A 3/11/04
SpotQC Titration Experiment • Plates tested were 70mers or Amplicons: • QAF01122005A 70mer • QBA12012004A 70mer • QLM11222004A 70mer • 3QSA12292004A 70mer • QSM01042005A 70mer • 2QSP11012004A Amplicon • QVC12032004A 70mer • QYP12102004A 70mer
SpotQC Titration Experiment • Slides were hybridized according to SpotQC protocol. • All slides were scanned on same scanner at PMT of 650. • Spotfinder was used to generate data from each tif image. • Log2 of signal intensities were calculated. • Box plots of data were created using Origin 7.5. • Data is visually represented as varying print lots across fixed concentrations as well as fixed print lots across varying concentrations.
Each chart below graphs the concentration of SpotQC across 8 different organism print lots.
QBA 0.5uM QBA 2uM QBA 1uM QBA 0.25uM QBA 0.1 QBA 0.01uM
Each chart below graphs an organism print lot at different SpotQC concentrations.