QM2002 Poster - Version updated 13-Jul-02
230 likes | 459 Vues
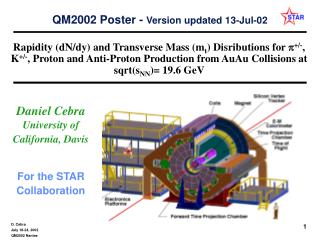
QM2002 Poster - Version updated 13-Jul-02. Rapidity (dN/dy) and Transverse Mass (m t ) Disributions for p +/- , K +/- , Proton and Anti-Proton Production from AuAu Collisions at sqrt(s NN )= 19.6 GeV. Daniel Cebra University of California, Davis For the STAR Collaboration. Abstract.

QM2002 Poster - Version updated 13-Jul-02
E N D
Presentation Transcript
QM2002 Poster - Version updated 13-Jul-02 Rapidity (dN/dy) and Transverse Mass (mt) Disributions for p+/-,K+/-, Proton and Anti-Proton Production from AuAu Collisions atsqrt(sNN)= 19.6 GeV Daniel Cebra University of California, Davis For the STAR Collaboration
Abstract Rapidity (dN/dy) and transverse Mass (mt) distributions for p+, p-, K+, K-, p, p- from central AuAu collisions at sqrt(sNN) = 19.6 GeV are studied as a function of rapidity for -0.4 <y <0.4 using the Solenoidal Tracker At RHIC. The mt-m0 spectra for these particles are used to determine the temperature and radial flow of the the emitting source and the yield of each particle species. Using the mid-rapidity p-bar/p ratio, and also the K-/K+ ratio which is sensitive to the valence quark content of the kaons, one can infer the net-baryon density. These data are of particular interest since this energy and baryon density regime is comparable to that for fixed target PbPb collisions at 158 AGeV (sqrt(sNN) = 17.2 GeV) at the CERN Super Proton Synchrotron (SPS). The systematic trend of the data from the baryon rich environment in 40 AGeV fixed PbPb collisions at the SPS (sqrt(sNN) = 8.8 GeV) to the baryon depleted region at RHIC (AuAu at sqrt(sNN) = 130,200 GeV) will be examined. Mid-rapidity pion ratios are used to image the residual positive charge of the pion emitting source and comparison is made to corresponding results from the the SPS, AGS, SIS, and RHIC (AuAu collisions at sqrt(sNN) = 130,200 GeV). The shapes and magnitudes of the rapidity density plots for p+, p-, K+, K-, p, p- are contrasted with those at higher and lower energy, and the scaling behavior for these distributions is examined in the context of the gluon saturation model.
A Typical 19.6 GeV event. Note that the track multiplicity is generally lower than STAR events at 130 or 200 AGeV.
The STAR Au+Au 19.6 GeV Data Set • The 19.6 GeV data set was taken on the final day of year-two heavy-ion running (09:15 25-Nov-01 to 06:26 26-Nov-01). The detector was run at HALF FIELD. • 12 data runs were recorded (2329088,...91-94,...100-101, 2330002-2330005) • “Minimum bias” trigger (ZDC coinc.&CTB>15 .or. No ZDC&CTB>600) • The production data is the pico-DSTfrom: /auto/stardata/starspec3/flow_pDST_production/reco/minBias22GeVZDC/ReversedHalfField/P02ge/2001/ • With no event selection cuts, we have: Nevents = 175466. • Selecting on collisions with vertices within 30 cm the center of the detector reduces this to 42412. • Total number of good top 10% centrality events = 5106.
Event Vertex Cuts Vertex Z location Vertex X and Y Location Note: The beam diamond is quite broad. The beam diamond for the 20 GeV run was fairly large. We imposed event vertex cuts to restrict our analysis to events with vertices within the center 30 cm of the detector, where the acceptance is the most uniform. We selected events with vertices within the center of the beampipe to eliminate contributions from triggers on secondary interaction with the beam pipe material. Before Cuts Note: The beam pipe is evident. 25.1 % of events pass this cut After Cuts 96.3 % of events pass
ZDC Trigger (147953) Counts CTB Trigger (27513) Nch Triggering for the 19.6 GeV dataset The STAR trigger was not optimized for 19.6 GeV Collisions. The correlation between ZDC and CTB that had been observed in the 130 and 200 GeV data sets was not seen in the lower energy collisions. To approximate a minimum bias trigger, events were selected if the satisfied either a minimum ZDC threshold or a minimum CTB threshold.
Centrality Determination 80% 60% 50% 40% 30% 20% 10% 5% The raw mid-y (|h|<0.5) charged particle multiplicity is shown on the left for the three RHIC collision energies. On the right the same data are scaled both horizontally and vertically to estimate the best positions for the centrality bias cuts. The cut lines correspond to percentages of the total minimum bias cross section. (Note the 20 GeV trigger had inefficiencies for collisions in the impact parameter range corresponding to 10-30%)
An Alternate Approach to Centrality Determination Limit to Correlation The Multiplicity distributions are scaled to the point where the correlation between mid-h and higher-h particle yield starts to break down. The Cut locations determined with this method are indistinquishable to those determined in the previous method. Put 10% Cut Here
100% Pass 91% Pass DCA (cm) Chi squared 98.8% Pass 68.2% Pass Fit Points Tracking Percentage Track Quality Cuts In addition to event quality cuts, individual track quality cuts were also imposed on the data. The distance of closest approach between the track and the main event vertex was limited to 3 cm. The c2 of the helix fit to the found points was limited to 2.5. The total number of points used in the fit was required to be greater than 25 (out of a maximum of 45). And the fraction of points used in the fit was required to be greater than half the possible number to avoid split tracks.
Kaons protons pions electrons Particle Identification Particle identification is achieved through relative ionization in the TPC gas. The plot to the right shows a scatter plot of the <dE/dx> of a track versus the log of its total momentum.
Fits to the dE/dx distributions We use a Bethe Bloch parametrization with three free parameters to account for detector effects. We determine these values with the well IDed particles and fine tune the parametrization for each condition. Fix the centroids and wdiths rigorously. Only free parameters in the fits are the amplitudes. This extends the fitting range beyond previous analyses. Fit for e,p, K, p. peK p Kaons and protons electron pions u= 2.8 ln (dE/dx) + 1.5
Particle Ratios - Au+Au @ 19.6 GeV The first observables are the particle ratios. These often require the fewest corrections. Still need to consider proton background! STAR PRELIMINARY RESULTS p+/p- K-/K+ p-/p+ R = 0.611 +/- .013 stat R = 0.093 +/- .003 stat +/- .004 sys Pion Ratio has structure as a function of mt-m0. Ratio is independent of mt-m0
Pion Ratios - Imaging the Source A comparison of the pi+/pi- ratios at different energies. From this comparison, we can find the Coulomb potential assuming a spherically symmetric geometry. As can be seen, the potential decreases as the collision energy increases. This is evidence of the depletion of the initial baryons in the central region. E866 PRC57 (1998) R446 KaoS PLB420 (1998) 20
Kaon and Proton Ratios Results are consistent with expectations Proton and kaon ratios for central events both increase with collisions energy. This illustrates the reduction in the net baryon content and/or the baryon chemical potential across this collision energy range from the AGS to the top energies at RHIC. At 19.6 GeV the collisions produced Baryon-rich matter. K-/K+ Publication in prep J. Berger STAR Preliminary results PRL04778 E866/917 nucl-ex 0008010 WA97 JPhys G25 (1999) 171 NA44 JPhys G23 (1997) 1865 NA49 NP A661 (1999) 45c
Estimated Efficiency Corrections TPC efficiency is influenced by many effects, including event multiplicity, vertex location, and detector configuration. We determined our efficiency for this analysis by simulating tracks in GEANT and then embedding those tracks into full events. These events are then analyzed and found tracks are associated with those that were embedded. This allows us to accurately determine the efficiency for a given detector configuration. In these figures, we show the embedded track distribution for midrapidity pions and in red the found track. The ratio of found to embedded is then the efficiency. Similar analysis is done for all other particle species and rapidity bins.
Efficiency Corrected Mid-rapidity Spectra K- p- p- A blast wave model simultaneous fit to these spectra yields: Tfo = 104 +/- 4 MeV br = 0.47 +/- 0.12 p+ K+ p+ STAR PRELIMINARY RESULTS
p 19.6 GeV data NA49 Results CERN Beam Request dN/dy near mid-rapidity p- p+ The yields of the various particle species near mid-rapidity are consistent with similar measurements at the SPS. The pions and positive protons demonstrate yields which are constant as a function of rapidity near mid-rapidity. The yields of the kaons and p-bars are peaked at mid-rapidity. K- K+ p+
Mid-rapidity K to p ratios R=0.111 +/- 0.003 stat +/- 0.029 sys R=0.187 +/- 0.004 stat +/- 0.031 sys Figure from NA49 Beam request 19.6 GeV Preliminary STAR result
Top 5% 5-10% 10-20% 20-30% 30-40% 40-50% 50-80% dN/dh as a Function of Centrality 19.6 GEV STAR PRELIMINARY RESULT The yields of charged particles as a function of centrality and rapidity show a dip at mid-rapidity for central events and are flat for peripheral events. 300 200 100
STAR PRELIMINARY RESULT PHENIX BRAHMS WA98 Phobos WA97/NA57 NA49 E917/866 E877 dN/dh Collision Energy Systematic The charge particle yield at mid-rapidity for central events (top 5 or 6%) is consistent with the trends established by AGS, SPS, and higher energy RHIC data. Phobos PRL 85 (2000) 3100 Phobos nucl-ex 018009 (2002) PHENIX PRL 86 (2001) 3500 STAR(130) nucl-ex 106004 (2001) BRAHMS QM2001 NA49 WA98 nucl-ex 0008004 (2000) WA97/NA57 CERN-EP-2000-002 E866/917 PRC59 (1999) 2173 E877 PRC51 (1995) 3309
v1 vs. Eta Most Peripheral Semi-Peripheral Directed Flow results for the 19.6 GeV Dataset STAR Preliminary Results Semi-Central Most Central
v2 vs. Eta Semi-Peripheral Most Peripheral Elliptic Flow Results for the 19.6 GeV dataset. STAR Preliminary Results Most Central Semi-Central
Conclusions • Studies of Pion ratios demonstrate the reduction of source charge consistent with a transport of the incident baryons beyond mid-rapidity. • Kaon and Proton ratios are consistent with SPS trends. The 19.6 GeV collisions create baryon-rich matter. • The temperatures and radial flow are consistent with other RHIC results, but suggest temperatures below those previously reported for SPS collisions. • dN/dy’s show magnitude and shape consistent with SPS results. The protons exhibit an elongation along the beam axis consistent with incident baryon transport. The produced kaons and p-bars are peaked at mid-rapidity. The pions, which have a strong delta resonance contribution are flat at mid-rapidity similar to the protons. • Kaon to pion ratios consistent/low wrt SPS. • dN/dh are consistent wrt SPS and RHIC results. • Preliminary Flow results. • Generally - agreement with SPS results.