Download
1 / 57
630 likes | 976 Vues
Web Service-Based Remote Monitoring System for Smart Home Space. Project for CSE535 Mobile Computing. Sheng Cai Joshua Ferguson Xinhui Hu Wei Wu. Introduction. Smart Home Space wireless sensor network deployed in home environment monitoring the home space Motivation

E N D
Web Service-Based Remote Monitoring System for Smart Home Space Project for CSE535 Mobile Computing Sheng Cai Joshua Ferguson Xinhui Hu Wei Wu
Introduction • Smart Home Space • wireless sensor network deployed in home environment • monitoring the home space • Motivation • remotely obtain the sensed data • retrieve the data pervasively • apply our system framework for extended functions
System Framework Database By:Wei Wu & Joshua Ferguson Home Space Home Gateway Sensor Internet Web Service Sensor Mobile User Sensor
System Framework • Web service • user based, require user name and password to login • generate user’s request for specific type of data, e.g. temperature • query the requested information and display it • Home gateway • handoff between home network inside the home space and internet outside • combined with database • functions of database • store the data transferred from sensors • send user’s request By:Wei Wu & Joshua Ferguson
Application1:Energy-efficient Data gathering schemes • We provide data gathering schemes in order to reduce energy consumption and finally increase the lifetime of the sensors. • Data gathering scheme based on user request • Data gathering scheme without user request By:Xinhui Hu
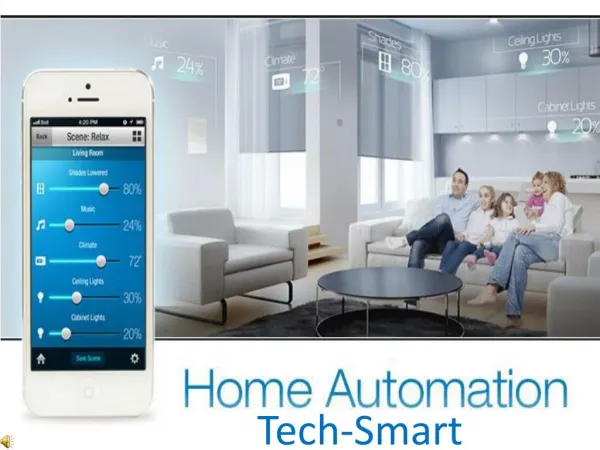
Application2:Temperature control • Adaptive and Intelligent: • Using the owner’s control orders and customs recorded in the database, the controller could automatically executes to make the environment to fit owner’s customs. By: Sheng Cai
Energy Efficient Building Environment Control Strategies UsingReal-time Occupancy Measurements Varick L. Erickson, Yiqing Lin, Ankur Kamthe,Rohini Brahme,Amit Surana, Alberto E. Cerpa, Michael D. Sohn and Satish Narayanan. Energy Efficient Building Environment Control Strategies Using Real-time Occupancy Measurements, BuildSys’09, November 3, 2009, Berkeley, CA, USA. Presented by Sheng Cai
Introduction • Heating ventilating and air conditioning (HVAC) systems account for 50% of the total energy budget in buildings. • Current systems often rely on building regulation maximum occupancy numbers for maintaining proper temperatures.
How to save energy? 1 Get room occupancy data in the building. 2 Make a model which has the capability to predict room usage patterns . 3 Modify the control system by the prediction model for energy saving.
Contribution 1 SCOPES: a wireless camera sensor network for collecting occupancy data in a multi-function building. 2 Multivariate Gaussian Model: a model for predicting occupancy patterns in buildings by using SCOPES’s data.
1 SCOPES The red and green lines indicate the locations of the transition boundaries. The gray areas indicate the area occupancies that can be derived from the transition data.
occupancy data When a person crosses any one of these transition points, the cameras capture and process the image data and, thus indicating the transition. SCOPES system detected 80% of all recorded transitions.
2 Occupancy Models • Multivariate Gaussian Model • Let Oh denote all occupancies that occur per second during hour h where 1 ≤ h ≤ 24, HB, HM, L, and Of refers to the Hallwayback, Hallwaymiddle,Lab, and Office areas occupancies. • n represents the number of observations in hour h.μHB, μHM, μL, and μOf denote the average occupancy. • We calculate a vector of means μh = {μHB,μHM,μL,μOf } and covariance matrix from Oh. • probability density function:
Multivariate Gaussian Model Results RMSE: root mean squared error NRMSE: normalized root mean squared error
Potential Energy Savings • 14% reduction in HVAC energy usage by having an optimal control strategy based on occupancy estimates and usage patterns. • 20% occupancy estimation errors have negligible impact (0.28%) on HVAC energy savings estimation of 14%.
Conclusions • Dynamic occupancy levels and patterns in buildings can be estimated, and the energy efficiency gains possible by utilizing actual facility usage information for building controls.
future research • Room occupancy data in the longer durations (days, months) could provide a more exact model. • Doing online HVAC control algorithm by using real-time data supported by a wireless camera sensor network.
HiCon: A Hierarchical Context Monitoring and Composition Framework for Next-Generation Context-Aware Services K. Cho, I. Hwang, S. Kang, B. Kim, J. Lee, S. Lee, S. Park, Y. Rhee, and J. Song, “HiCon: A Hierarchical Context Monitoring and Composition Framework for Next Generation Context-Aware Services,” IEEE Network, July 2008. Presented by Joshua Ferguson
Current App developers 're-invent' context-monitoring schemes Futile work – Why do this? No established framework to use Additionally, context-monitoring has many geographical scales Historic Problem
Framework design Focused on upward scalability Body, Local Region, Global Implementation of each, with an application for two BAN Games, Taxi Cab Management, Core Functions (very) Brief conclusion Overview of Paper
SympaThings – Household objects respond to personal emotions Running Bomber – Cooperative game for exercising on treadmill Fun Part First – Applications: BANs
Ubiquitous taxiCab – Taxi Dispatching Service Matches Taxi dispatching to passenger arrival patterns in predictive manner U-BattleWatcher – Monitors soldier contextual information, and tracks location of enemy forces Fun Part First – Applications: Local Region
Each level of context is centered around one central object BAN – PocketMon, Region – HiperMon, Global – EGI (Efficient Global Infrastructure) The Context Gateway provides two-way access to upper level context information Framework Overview
Architecture: PocketMon Sample PCMQ (Personal Context Monitoring Query): { CONTEXT (location == Library) AND (activity == sleeping) AND (time == evening) ALARM F → T DURATION 120 days }
HiperMon • Responsible for collecting many contexts and matching queries to them • Necessarily capable of high-performance massive context processing
HiperMon (cont…) • Uses mainframe-like dataflow evaluation methods to effectively process thousands of queries. • Imagine every restaurant in a large-sized city registered a query or two. Could range in the 10,000’s of concurrent and continuous queries, just for restaurants. • Implemented using ‘Border Monitoring Query’ • Sets of queries are evaluated to find data boundaries • The continuous stream of information generated by individual context switches is then tracked, and when boundaries are crossed, the associated services are notified.
EGI • Cluster heads abstract the context delivery requirements of their children • Global and Local proxies are responsible for coordination of communication in their respective domain.
Evaluation - PocketMon • Throughput is the maximum number of queries that can be handled without creating a growing backlog • Conventional Context Monitoring Methods – Classification of context states for each query. Apples to oranges comparison of frameworks.
Evaluation – UbiCab on HiperMon • Performed on a simple 1.4 Ghz CPU and 4GB RAM. • Streams are context evaluations, in the form of tuples. • Findings suggest UbiCab can coordinate taxis in a small/mid sized city using HiperMon
No evaluation of Global level scaling of framework. Lack of convincing evaluation at PocketMon scale. Needs review or comparison against other similarly multi-scale frameworks. Criticism
Take-Aways • Centralized context information definitely streamlines efficiency, but at what cost? • Privacy? Public control? • How can we balance providing useful regional context services while effectively anonymizing users when required? • Food for thought. . . • Google/Microsoft have both implemented some sort of Region-level context monitoring combined with their mapping services.
Web-based Remote Monitoring of Live EEG Philip D. Healy, Ruairi D. O’Reilly, Geraldine B. Boylan, John P. Morrison 2010 12th IEEE International Conference on e-Health Networking Applications and Services (Healthcom) Presented by Wei Wu
Introduction • The prompt analysis of EEG data captured in ICU is essential • only a limited windows of opportunity for treatment may be available • e.g. hypoxic-ischemic encephalopathy (HIE) • EEG is a prognostic value in the case of it • commence within 6 hours of birth: sensitive in delay • Solution • provided that the process of transferring the EEG data between locations: does not introduce delays • our system: web-based EEG remote monitoring system that allows live recordings to be viewed in near-real-time while acquisition is ongoing • The only tool required for viewing EEG data is a modern web browser • It is ubiquitous, data analysis is not limited by geographic location.
Related Work • An early method of remote monitoring of EEG and other physiological data • involved analogue transmission over telephone lines • allow for real-time monitoring, constrained by poor bandwidth to a limited number of channels • A neurosurgery ICU monitoring system was developed at UCLA • provided a web interface to physiological signal data • remotely monitor the dynamic generation of plots that are viewed as images embedded in HTML pages • lack the immediacy available • The BRIAN system • allows for interactive, but nonreal-time, • remote monitoring using compressed digital transmission
System Overview • The system is comprised of three components • an upload application • transfer data from the acquisition location to the data server • running on the file server, streams data from the EEG data file to the data server • file server is not accessible outside the hospital LAN because it contains sensitive patient information • a data server • act as a repository of recorded data, and provides the interfaces necessary for both humans and software to interact with the data • streamed to the viewing application running on the neurophysiologist's PC • a viewing application • monitor individual recordings viewing application upload application
Data Acquisition and Uploading • A more "hands off" approach • the required data extracted from the EEG data file output by the acquisition software: performed on a file server • the strategy currently used for data acquisition in the upload application • All EEG data found in the file server when it is first opened are uploaded immediately • Thereafter, the upload application continually monitors the data file's access time in order to detect the addition of new data. When a change is observed, the newly added data are uploaded.
Data Storage • Data server is a standalone application: acts as a bridge • Confidentiality preservation • avoid the acquisition of unnecessary patient data • upload application does not read demographic patient information from data files, and the data server has no facility for storing it • recordings are identified either by their recording ID or the location and time that acquisition commenced • Data storage • an embedded SQL database for storing recording information • recording attributes such as the acquisition location, commencement time • a collection of data files containing sample values • sample values is maintained for each channel of each recording
Data Storage cont. • A web interface • hosted by an embedded HTTP server • the user must first log into the web application hosted on the server by providing a user name and password • upon successful login, the user is presented with a list of the recordings available on the server • for each recording, three options are available • view detailed information about the recording • download the recording in EDF • open the recording in the viewing application • A REST interface • also hosted by the embedded HTTP server • to support the functionality of the upload and viewing applications • for the upload application, POST requests are supported for creating recordings and appending sample data to them • for the viewing application, GET requests are provided for retrieving recording information and downloading arbitrary intervals of sample data
Remote Monitoring • Compared with a simple plot, display of EEG tends is more complex • switch between several different montages when analyzing a recording • two viewing modes are provided • a review mode: switch instantaneously between one screenful of data at the user's discretion • a "playback" mode: simulate the acquisition process • A plugin technology • Flash, Java and Silverlight • Flash was chosen for its ubiquity and excellent graphics support • Display the data • once the upload of a recording to the data server has commenced, the recording may be viewed by users with access to the data server • next, the application begins to download signal data from the data server, check its changes
Conclusion and Future Work • A general technical solution for soliciting expert feedback on data being streamed from critically ill patients • Provide several secondary benefits • allow engagement in activities such as archiving, data mining • Remote monitoring reduces diagnosis turnaround time • Future Work • reduce the delay between the acquisition of data and its availability in the viewing application • compression scheme • end-to-end encryption • addition of video support
Location Based Sleep Scheduling for Target Tracking Applications in Smart Space Environments By: Ben Harrison, Alan Marshall IEEE Communications Society subject matter experts in the IEEE ICC 2009 Xinhui Hu
Outline Motivation Related work LocMAC Results Conclusion
Motivation Smart Space How to monitor our patients’ behaviors?
Motivation Smart Space Please use us!
Motivation Smart Space I am out of battery!
Related work • SMAC uses a fixed sleep schedule for the entire network. • DMAC expands upon SMAC by adding a limited dynamic sleep cycle, based on network latency and power availability on a node by node basis. • PMAC adjusts sleep schedule for the whole network based on its current network throughput.