Download
1 / 41
410 likes | 429 Vues
SN Ia Margutti Raffaella,2005. 1. Observational methods. High-z SN experience. (High-z Supernova Team). 2.SN types and Progenitors. SNe II: We can find them only in spiral galaxies (extreme I population).

E N D
SN Ia Margutti Raffaella,2005
High-z SN experience (High-z Supernova Team)
2.SN types and Progenitors • SNe II: • We can find them only in spiral galaxies (extreme I population). • Type II SNe mark the end of the nuclear energy production in massive stars (>8 solar masses), and the start of a ‘new’ life as a neutron star. • They are believed to originate from CORE COLLAPSE of a massive progenitor star with plenty of H. To be more precise it’s important to say that for SN IIb most (NOT all) H is removed during evolution by tidal stripping.
Type II Supernovae Parameters From : “Supernovae and Nucleosynthesis”,Arnett,1996.
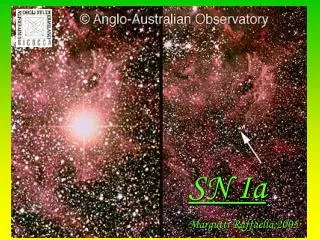
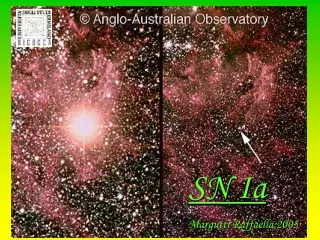
SNe I: I a • In all Hubble type galaxies (Pop II or disk). • They are believed to originate from thermonuclear disruptions of accreting WDs in close binary systems. • The issue of how the WDs grow to the Chandrasekhar mass is still an open question. We have different possibilities. Among them: • Mergers of double degenerates resulting in the formation of a M>MCH and carbon ignition. • Accretion of H from a main sequence or evolved companion. • Sub-Chandra explosions.
What energies are available from thermonuclear events? From : “Supernovae and Nucleosynthesis”,Arnett,1996.
Type Ia Supernovae Parameters From : “Supernovae and Nucleosynthesis”,Arnett,1996.
I b-c • We can find them only inspiral galaxies (extreme pop I). • They are believed to be the result of an iron core collapse, and hence to be physically related to type II SNe. From an observational point of view we are able to recognize SN types from their • Spectra. • Light curve. See next slides for more…
4.Light-curves SN II (From Arnett,1996.)
SN Ia • The rate of the decline of the light curve correlates with the absolute magnitude at maximum (Phillips relation,2003) • The peak is proportional to the mass of 56Ni synthesized during the explosion. • The light curve is powered by a “late time “ source: that is the radioactive decay: (56Ni 56Co 56Fe) • The light curves peaks at 10-15 days after core collapse and then declines because of the increasing transparency of the ejecta and because of the decreasing number of radioactive elements. • Galaxies having a younger stellar population appear to host the most luminous SNeI-a. • See Arnett,1996,Appendix D, for a complete derivation of supernovae light curve shapes.
5.Properties of a perfect standard candle: • It would be extremely bright. • It would always have exactly the same ABSOLUTE magnitude. (in particular this means that it wouldn’t suffer of EVOLUTION). • If the absolute magnitude depends on the environment (e.g. Hubble type) it should be well known. • Small corrections should be applied (fore/back ground absorption). • Easy to calibrate.
Standard Candles A population of unevolving sources, having a fixed intrinsic luminosity at ALL redshifts Supernovae Ia
6.SNe Ia as distance indicators • They are exceedingly luminous , with peak MB averaging -19 mag if H0= 72 (Kms-1Mpc-1).(Filippenko,2004) • “Normal” SNe Ia have small dispersion around their peak absolute magnitudes σ ≤ 0.3 mag.(Filippenko,2004). • Our understanding of the progenitors and explosion mechanism of SNe Ia is on a reasonably firm physical basis. • Little cosmic evolution is expected in the peak luminosity, and it can be modeled. • It’s possible to perform local tests of various possible complications and evolutionary effect by comparing nearby SNe in different environments.
7.Possible evolution of SNe Ia EVOLUTION ( linked with changes in metallicity, mass and C/O ratio of the progenitor,) could lead to: 1.Lower peak luminosity of SNe at high redshift; Overestimated distances 2.More powerful explosions; Underestimated distances Problem: it’s difficult to obtain an accurate, independent measure of the peak luminosity it’s difficult to directly test for LUMINOSITY EVOLUTION. Solution: we can easily determine if whether other observable properties of high-z and low-z SNe Ia differ. (If they are all the same is probable that the peak luminosity is constant a well !!!!)
Observational results about evolution: • SNe Ia & host galaxy morphology: the SCP (Supernova Cosmology Project) found no clear differences between the cosmological results obtained with SNe Ia in late-type and early-type galaxies. (Sullivan et al.,2003) • SNe Ia & rise time (from explosion to maximum brightness): no significant difference between high-z and low-z SNe Ia (even if at high red-shift we have usually shorter rises times). (Filippenko,2004). • Number of progenitors: higher in high-z SNe. Although there is NO clear signs that cosmic evolution of SNe Ia seriously comprises our results, it is wise to remain vigilant for possible problems.
8.Possible effects of extinction: Luminosity distances have to corrected for interstellar absorption occurring in the host galaxy and in the Milky Way. From an observational point of view: • Extinction corrections based on the relation between SN Ia colors and luminosity improve distance precision for a sample of nearby SNe Ia which include objects with substantial extinction (Riees et al.,1996). • The consistency of the measured Hubble flow from SNe Ia with late-type and early-type host galaxies shows that the extinction corrections applied to dusty SNe Ia at low red-shift don’t alter the expansion rate from its value measured from SNe Ia in low dust environments • The scatter in the Hubble diagram is much reduced. (See next slide).
Hubble diagram for SNe Ia (The ordinate shows the distance modulus) TOP: The objects are assumed to be standard candles and there is no correction for extinction; the result is σ=0.42 mag. BOTTOM: the same objects after corrections for extinction and intrinsic differences in luminosity. The result is σ=0.15 mag. (From Filippenko, 2004).
Gray dust: THE PROBLEM: Large dust grains ( GRAY DUST) ,would not imprint the reddening signature of typical interstellar extinction upon which our corrections necessarily rely. Could a evolution in dust-grain size cause us to underestimate the extinction? THE SOLUTION: Viewing SNe through such gray interstellar grains would also induce a dispersion in the derived distances. With a mean gray extinction σ≈ 0.25 mag (the value required toexplain the measured distances without a cosmological constant), the expected dispersion would be σ≈ 0.40 mag. This is significantly larger than the 0.21 mag dispersion observed. The observational results favor the NO-Dust hypothesis (Riess et al.,2000).
9.Cosmological results (1999)
From SNe Ia From CBR studies
WMAP (2003): ΩM = 0.27±0.04 ΩΛ = 0.73±0.04 Ωtot = 1.02±0. 02 SN Ia (2004): Ωtot = 0.94±0.26
10.References • Arnett,1996: “Supernovae and Nucleosynthesis”, Princeton University Press. • Filippenko,2004: The accelerating universe and dark energy: evidence from type Ia supernovae,Lect.Notes Phys,646, 191-221. • Riees et al.,1996:Astroph. J.,473,88. • Riees et al.,2000:Astroph. J.,536,62. • Sullivan et al.,2003:astro-ph/0211444.