Download
1 / 35
350 likes | 493 Vues
Estimating Economic Loss from Flooding: A Study of Porter County, Indiana. Samantha Cornwell Valparaiso University March 2, 2011. My Study. Hurricane Ike and its effect on Porter County Defining Porter County as an adequate study region Why did Porter County have severe flooding?

E N D
Estimating Economic Loss from Flooding:A Study of Porter County, Indiana • Samantha Cornwell • Valparaiso University • March 2, 2011
My Study • Hurricane Ike and its effect on Porter County • Defining Porter County as an adequate study region • Why did Porter County have severe flooding? • What is lost during a flood?
My Study • Define economic loss • Use HAZUS-MH to create a case study • Determine pros and cons for using the software for a case study • Next steps 3
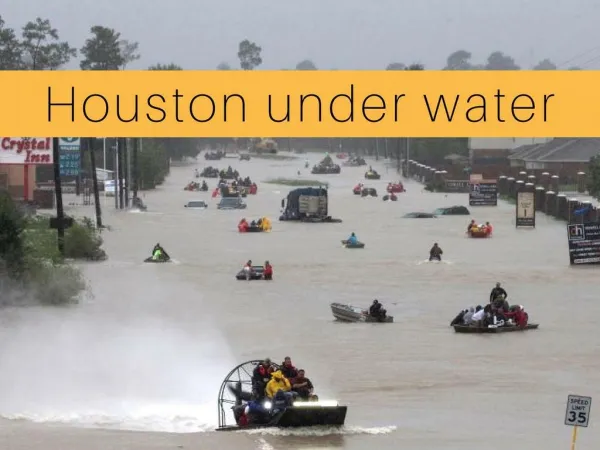
Hurricane Ike • Hurricane Ike strikes Galveston, TX, on September 13, 2008. • Hurricane Ike • Category 4 Storm • Responsible for 112 deaths, 23 still missing in US • Estimated $29.6 billion in damages on coast and inland
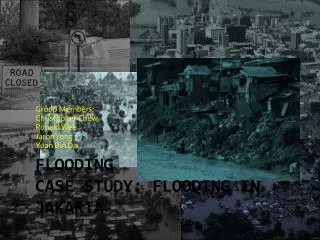
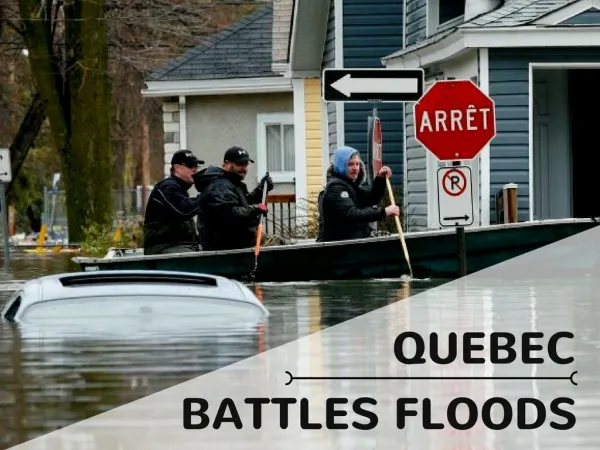
Hurricane Ike Repercussions • September 23, 2008: • 3 IN Counties were under State of Emergency • Lake, Porter, and LaPorte • Flash floods from heavy storms cause 2 deaths in Chesterton • Other communities heavily hit (thousands homeless, injured, etc.)
How was Hurricane Ike different? • Path different • Previous storms raised river and stream levels • Hurricane Gustav • Hurricane Hanna
Rainfall map created by David Roth, • Hydrometeorological Prediction Center Text
The Study Region • Porter County, IN • FIPS: 18-127 14
Porter County Profile • Population of approximately (2009) 163,598 (2.55% of total) • Population under 18 - 24.0%, 24.7% • Population over 65 - 12.2%, 12.9% • Population with a disability - 21,490 (2.03% of total) • 66,588 housing units (2.37% of total) • Poverty level - 8.7%, 12.9%
Porter County is an average county in Indiana, and it is an adequate study region for this project.
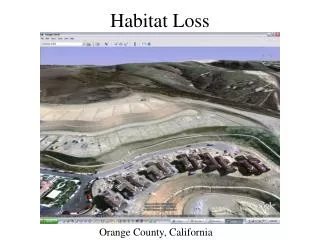
Why was there a flash flood? • Southern Lake Michigan counties relatively flat • Lack of levees and dams in place • Lack of natural drainage systems • Already high stream and river levels • Intense, heavy rains for a several-day period
Flooding Issues • Damaged buildings, homes, property • Inaccessible streets for emergencies • Lifelines damaged • Casualties and injuries (indirect or direct) • Waste and clean-up
How do Emergency Managers handle Flash Floods? • Quick response • Save people, then property • Higher ground • Shelters • Block off roads and lifelines • Greater than 6 in. of moving water • “Turn around, Don’t drown!” campaign • Law enforcement barriers • Emergency communication and power lines • Prevent major economic loss • Food and water
What is Economic Loss? • A quantifiable dollar or unit amount that represents an estimate of property damage that has or will affect the economy of local, national, or international boundaries. 34
How to Determine Loss from Flooding • Short-term/immediate losses • Housing/buildings with devastation • Roads • Lifelines • Long-term losses • Waste • Housing/buildings with minor damage • Damaged property • Calculations are NOT a reflection of reality, only approximations
Example Case Study • HAZUS-MH • FEMA-based Hazard Study software • ArcGIS • Geographic Information System software • Charleston, SC • Definable study region • Affected by multiple hazards • Inland river flooding (100, 500-year event for specific area) 36
Results from Case Study • Direct economic loss • Annual gross sales, business inventory, restoration time, rental or income lost • Indirect economic loss • Annual Income (mil) , number of employees, synthetic economy type, percentage of rebuilding, unemployment rate, outside aid, interest rate • Indirect loss is nearly always greater than direct economic loss
What Did and Did Not Work • Able to define topography for Porter County • Unable to delineate the floodplain • Could only create 50, 100, 500-year events; need to create a random event based on flash flood conditions • Able to see damage results for population density in Census Tract study 38
Next Steps • Determine flood levels throughout Porter County during the event to obtain more accurate picture • Determine losses by comparing economic data before and after September 2008 • Create maps to show flash flood data for a series of days • Make a connection between estimations and real-life data, Porter County and other regions 39
Conclusions • Hurricane aftermath affects counties in the storm’s path, especially with flooding. • Porter County is a good study region. • Flash flooding is a serious problem in low-lying Midwestern counties. • HAZUS-MH is a tool worth improving. • Eventually able to make random flood events to simulate flash floods 37
Thank You! • Prof. Bharath Ganesh Babu • Kevin Mickey, POLIS • Rusta Ault • Michael Siano • Sharon Cornwell • Dr. Robert Cornwell • Sam Ryan • Sara Harrison • Joan Bukovic • Will Milhans • Adam Cooper • Vince Leidig 40