Download
1 / 1
10 likes | 131 Vues
INVESTING IN YOUR FUTURE. Monitoring stations. Bērze. Mellupīte. 100 200 Km. INVESTING IN YOUR FUTURE. Nitrogen and phosphorus trend analysis in Latvia agricultural monitoring stations.

E N D
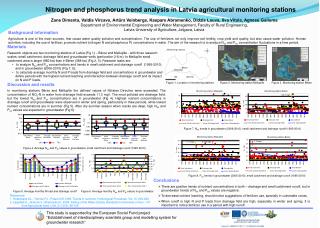
INVESTING IN YOUR FUTURE Monitoring stations Bērze Mellupīte 100 200 Km INVESTING IN YOUR FUTURE Nitrogen and phosphorus trend analysis in Latvia agricultural monitoring stations Zane Dimanta, Valdis Vircavs, Artūrs Veinbergs, Kaspars Abramenko, Didzis Lauva, Ilva Vītola, Agnese Gailuma Department of Environmental Engineering and Water Management, Faculty of Rural Engineering, Latvia University of Agriculture, Jelgava, Latvia Background information Agriculture is one of the main sources, that cause water quality pollution and eutrophication. The use of fertilizers not only improve soil fertility, crop yield and quality, but also cause water pollution. Human activities, including the use of fertilizer, promote nutrient (nitrogen N and phosphorus P) concentrations in water. The aim of the research is to analyze Ntot and Ptot concentration fluctuations in a time period. • Materials • Research objects are two monitoring stations of Latvia (Fig 1) – Bērze and Mellupīte - with three research scales: small catchment, drainage field and groundwater wells (perforation 2-6 m). In Mellupīte small catchment area is larger (960 ha) than ir Bērze (368 ha) (Fig 2, 3).Research tasks are: • to analyze Ntot and Ptot concentrations and trends in small catchment and drainage runoff (1995-2010) and in groundwater (2006-2010) (Fig 7, 8); • to calculate average monthly N and P loads from drainage field and concentrations in groundwater and define periods with the highest nutrient leaching and interaction between drainage runoff and its impact on N and P loads. Project Nr. 2009/0212/1DP/1.1.1.2.0/09/APIA/VIAA/060 Discussion and results In monitoring stations Bērze and Mellupīte the defined values of Nitrates Directive were exceeded. The concentration of NO3-N in water from drainage field exceeds 11.3 mg/l. The most polluted are drainage field, but the lowest Ntot and Ptot concentrations are in groundwater (Fig 4).Highest nutrient concentrations in drainage runoff and groundwater wereobserved in winter and spring, particularly in thaw periods, while lowest nutrient concentrations are in summer (Fig 5). After dry summer seasonwhen cracks are deep, high Ntot and Ptot values are expected in groundwater (Fig 6). Figure 1. Location of monitoring stations Figure 2. Monitoring station Mellupīte Figure 3. Monitoring station Bērze 102.7 mg/l Figure 7. Ntot trends in groundwater (2006-2010), small catchment and drainage runoff (1995-2010) 2.13 mg/l 1.11 mg/l 0.709 mg/l Figure 4. Average Ntot and Ptot values in groundwater, small catchment and drainage runoff (1995-2010) Figure 8. Ptot trends in groundwater (2006-2010), small catchment and drainage runoff (1995-2010) • Conclusions • There are positive trends of nutrient concentrations in both – drainage and small catchment runoff, but in groundwater trends of Ntot and Ptot values are negative. • To decrease nutrient leaching, should notice suggestions of fertilizer use, specially in vulnerable zones. • When runoff is high N and P loads from drainage field are high, especially in winter and spring. It is important to notice fertilizer use in a period with high runoff. Figure 5. Average monthly N load and drainage runoff Figure 6. Average monthly Ntot and Ptot values in groundwater • References: • 1. Heathwaite A.L., Yohnes P.J., Peters N.E.1996. Trends in nutrients. Hydrological Processes, Vol. 10, 263-293. • 2. Lagzdiņš A.,Jansons V., Abramenko K. 2008. Setting of the Water Quality Standards for Nutrients in Run – off from Agricultural Land. LUA, 21 (315), 96-105. This study is supported by the European Social Fund project “Establishment of interdisciplinary scientists group and modelling system for groundwater research” Contact information: Institution: Latvia University of Agriculture Project contact person: Zane Dimanta Address: 19 Akademijas Str., LV-3001, Jelgava, Latvia E-mail: z.dimanta@gmai.com Web page : www.puma.lu.lv