Download
1 / 9
90 likes | 166 Vues
Analyzing Region 3's 2003 performance, setting growth targets for 2004, and focusing on key issues and strategies for improvement.

E N D
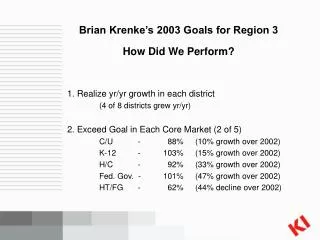
Brian Krenke’s 2003 Goals for Region 3How Did We Perform? 1. Realize yr/yr growth in each district (4 of 8 districts grew yr/yr) 2. Exceed Goal in Each Core Market (2 of 5) C/U - 88% (10% growth over 2002) K-12 - 103% (15% growth over 2002) H/C - 92% (33% growth over 2002) Fed. Gov. - 101% (47% growth over 2002) HT/FG - 62% (44% decline over 2002)
3. Five Region 3 Districts Attain Plan in 2003 ( 2 Districts Attained Goal) 4. Three of 8 Districts Ranked in Top 10 in $/BPI Attained Goal! (St. Louis, MRG, Healy) 5. 2003 Rookie of the Year
Region 3 2003 Performance 80% of Goal (63.4 million vs. 79.8 million) $/BPI = $2,238,264 vs. 2,762,689 Net result was Region 3 remained virtually flat from our 2002 performance.
Growth Targets for 2004 in Region 3 Regional Target - 77,300,000 (20% growth from 2003) Core Market Growth Targets C/U - 28,200,000 (24% growth) K-12 - 12,000,000 (16% growth) H/C - 8,250,000 (37% growth) Fed. Gov. - 4,000,000 (16% growth) HT/FG - 10,000,000 (34% growth)
RVP Goals for Region 3 in 2004 1. One new Fortune 1000 Account with sales in excess of 500K. 2. Three K-12 Dealers with sales in excess of 500K. 3. Three Districts in Top 10 $/BPI 4. Exceed Region 3 Wall Goal - Target 7 Million 5. KI 2004 Rookie of the Year
Region 3 Wall Performance 2000 = 8.1 million (5.5 Level 3) - 2.6 million 2001 = 6.2 million (3.8 Level 3) - 2.4 million 2002 = 1.7 million 2003 = 1.5 million Similar BPI to R1 & R2, R1 = 6 million in 2003, R2 = 9.5 Million What issues are preventing Region 3 from penetrating the Wall Market? Regional Wall Specialists (Tim Heide, Dennis Lamb) Potential Alliances
Focal Points in 2004 District Managers - Is your district operating at targeted headcount Is your team deployed effectively Is staff properly trained How often are you coaching/adding value
Focal Points in 2004 District Managers - Qualified Opportunities - New Projects Market Direction Ability to win business profitably Does sales team understand their responsibilities Communication - Frequency and content (measurements)
2004 Key Issues In Region 3 1. Identify - Review issues Region 3 District Managers have identified as “critical” to their teams success. 2. Prioritize - As a team, prioritize these issues. Brian Krenke will utilize information to set his focus for the 2004 fiscal year. 3. Communicate - Open discussion regarding frequency, level and content of communication with your RVP.