Download
1 / 17
170 likes | 190 Vues
This study analyzes the angular distribution of atmospheric muons in the AMANDA detector at a depth of 1730m. Results show the effectiveness of the detector and potential for future studies.

E N D
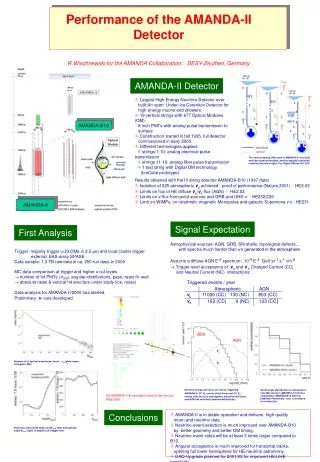
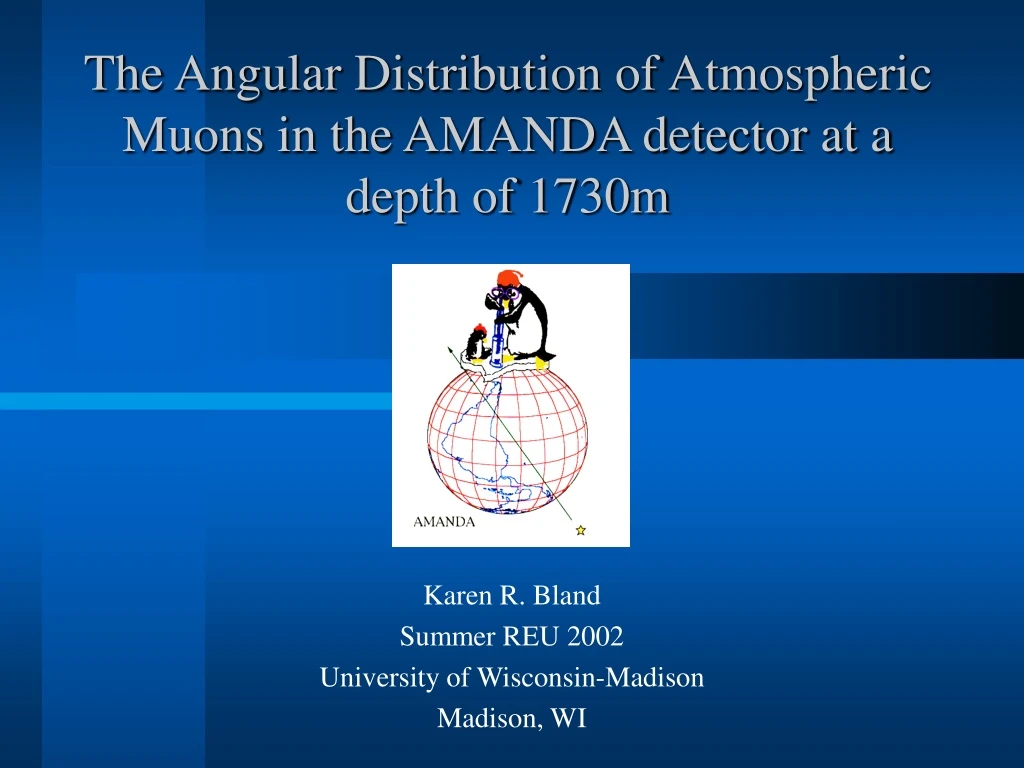
The Angular Distribution of Atmospheric Muons in the AMANDA detector at a depth of 1730m Karen R. Bland Summer REU 2002 University of Wisconsin-Madison Madison, WI
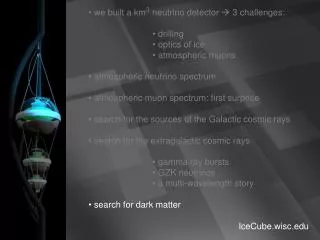
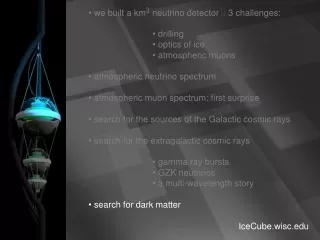
Overview • Introduction to AMANDA • Atmospheric muons • Analysis • Results • Some conclusions • Future studies
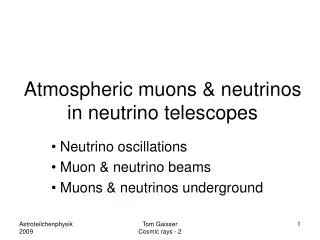
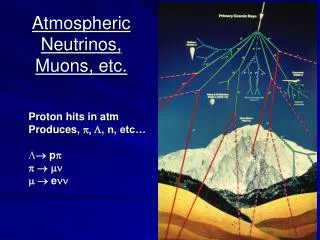
Produced by cosmic rays hitting atmosphere Background to neutrino analysis Atmospheric Muons
Monte Carlo (MC) Simulation codes: Corsika, Corama, MMC, Amasim Data AMANDA-II (year 2000) data ~ 13,000 sec of lifetime (3.5 hrs) Same analysis is performed on MC and data: Hit cleaning Filtering Quality cuts Analysis
Quality Cuts • Optimizing • Removing mis-reconstructed events • Angular resolution • Data/MC response • Stability
Cuts (cont’d) • Cuts: • Length of direct hits >120 m • Track smoothness between –0.26 and +0.26 • The time-likelihood fit reconstruction < 7.8 • Passing rates: • MC: 62.5% • Data: 56.0%
MC true zenith angle reconstructed zenith angle Data reconstructed zenith angle Unfolding the detector data
Results: Angular Distribution Angular Distribution of Downgoing Muons at 1730 m Angular Distribution of Downgoing Muons at 1730 m S. Klimushin curve Data fit – 85 % MC fit – 68 % S.I. Sinegovsky curve Data fit – 73 % MC fit – 59 %
Results: Angular Distribution / Depth-Intensity Slant Depth Intensity of Down-going Muons Angular Distribution of Downgoing Muons at 1730 m
Some conclusions • Atmospheric muon flux in AMANDA-II • MC-data deviation: ~ 7.5% • There is a systematic effect around 30 degrees from vertical • Horizontal resolution is still poor
Other things to look at… • Other ice models • Different depths • Different times of the year • Energy threshold dependence • Vertical depth intensity • Comparisons with other groups
Acknowledgments • Dr. Paolo Desiati • Dr. Albrecht Karle • The UW-Madison AMANDA group • The AMANDA collaboration • Dr. Bob Benjamin • The astrophysics REU group • National Science Foundation
Dependence on energy: MC, E = 50 GeV Data, E = 50 GeV MC, E = 25 GeV Data, E = 25 GeV