Download
1 / 29
290 likes | 420 Vues
Getting the Most Out of Customer Surveying Case Study by Williams-Sonoma/Pottery Barn. Cindy Treptow ECHO Client Support Consultant, inContact Bobbie Royal Quality Service Manager, Williams-Sonoma. Surveying Today?. Agenda. What we’ll be discussing:

E N D
Getting the Most Out of Customer SurveyingCase Study by Williams-Sonoma/Pottery Barn Cindy Treptow ECHO Client Support Consultant, inContact Bobbie RoyalQuality Service Manager, Williams-Sonoma
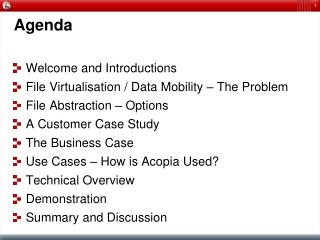
Agenda • What we’ll be discussing: • Basics of setting up an effective survey process • Case Study: learn how to use your feedback data to link back to performance and ROI
“For the thousandth time, I don’t want to take part in a survey!”
Getting Started with Surveys Step 1 Decide what you want to accomplish! • Examples: • Feedback to agents? • Feedback on product? • Navigation through your IVR? • Overall company impressions?
What Next? Step 2 Deciding the survey method to use • Pros and Cons of: • Snail mail • Email • Live Agent • Automated IVR • Web
Response Rate Information Source:
Finally! Step 3 Designing your questions • One of the longest steps in the process • Everyone wants input • Things to think about (# of questions, simple) • Think about the answers too! • Testing
Best Practice Do’s and Don’ts • Don’t ask your customer questions about things you should already know about them • Do make your survey length match the survey method • Don’t over survey—but don’t under survey either • Do make the survey experience a positive one for your customer!
Company Profile • Chuck Williams founded Williams-Sonoma in 1956 in Sonoma, California. Currently we have: • Corporate Headquarters in San Francisco, CA • Over 620 Retail Locations • Three Catalog Customer Care Centers • E-Commerce Web Sites • Distribution Centers in Memphis, TN; Olive Branch, MS; Ontario, CA and Cranbury, NJ
Customer Care Centers • Las Vegas, Nevada (450 associates) • Pottery Barn, Pottery Barn Bed & Bath and Williams-Sonoma Home • Oklahoma City, Oklahoma (400 associates) • Williams-Sonoma, West Elm, Pottery Barn Kids and Pottery Barn Teen • Shafter, CA Satellite Center (20 associates) • Pottery Barn Sales • Employee over 1000 associates during off peak and over 1300 during peak • Care Centers will handle over 5m contacts in 09
Before ECHO • Associates’ quality was based on their monthly monitoring score and accuracy rate • 5 calls/month were monitored per associate by a quality team (14 F/T) and/or supervisors • Many different forms and scoring methods • Calibrations were not done or were ineffective
Why ECHO? • We needed a better way to measure quality…something that focused on our customers and motivated our associates to perform to the best of their abilities • Associates receive feedback directly from our customers using the CSR Report Card • Statistically significant number of surveys completed per associate • Associates could focus on their behavior to satisfy customers • Identify superstars • Allowed us to understand who our dissatisfied customers were and why
Our Current Quality Program • ECHO surveys launched in the Las Vegas Care Center June 2003 as a pilot, then in Oklahoma City in 2004 and we opened the Shafter Satellite Center this year • Service Recovery Team was formed in 2003 with the pilot • ECHO scores were included in the associates Essential Functions starting in 2004 • Reducing Trigger Rates were part of the Care Center initiatives in 2008
How it Works • Customers are surveyed by email on Sales, Service and Internet transactions • Associates receive an average of 30 surveys per month • Service Recovery is done by our Service Enhancement Team – 9 F/T associates handle an average of 250 triggers per month (very dissatisfied, dissatisfied, and unresolved) • Re-surveys are sent on our Service Enhancement Team to measure service recovery
How We Use ECHO • ECHO is the largest part of our Care Center Quality Program and used to measure associate performance • A tool for supervisors during team meetings, monthly development discussions and side by side coaching sessions • Associates are expected to view their CSR Report Card • Use customer comments for motivation and recognition • Identify areas of opportunity to drive customer satisfaction • Measure supervisor performance (shift bids, bonus and annual reviews) • Determine primary reasons for customer dissatisfaction and measure year over year performance
What ECHO Provides • ECHO provides us the flexibility to change our survey questions • Asking satisfaction with the associate and satisfaction with the brand • Frequency of shopping • Determine drivers to fit our business • Capture current trends • Monitor the impact of business decisions/contest • Support
Service Recovery 82.24% 84.55% 17.2% 11.09%
81.31% 43.49% 82.45%
Drill Down to Associate Level Suzy 3185 X 16.67% X order sz. = $227,066.15
What We See Today • The return from performing service recovery • Impact of moving Top Box (frequency) • Dissatisfied responses are a small percentage that represent substantial lost income • The cost associated with lower performing associates and the value of high performing associates
Every Customer Has Opinions
Key Takeaways One Two Three Use the appropriate feedback method and survey questions to get understandable and actionable data Use that data to: Reduce overall costs Increase Customer Satisfaction Increase Profits For the best survey results, know what you want to accomplish from the feedback