Download
1 / 17
170 likes | 290 Vues
This lecture provides a comprehensive overview of designing analytical strategies for isotope geochemistry, with a focus on error analysis, sample handling, and understanding systematic and random errors. Key topics include identifying sources of contamination, determining isotopic concentrations, and assessing errors through internal and external measurements. Example case studies, such as U isotope ratios and their statistical significance, offer practical insight into error propagation and efficient data analysis. The lecture serves as a valuable resource for geochemists seeking to enhance precision and accuracy in their analytical work.

E N D
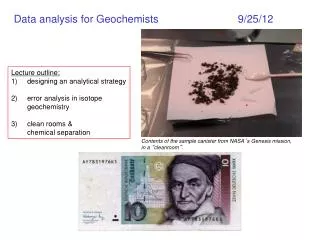
Data analysis for Geochemists 9/25/12 • Lecture outline: • designing an analytical strategy • error analysis in isotope • geochemistry • clean rooms & • chemical separation Contents of the sample canister from NASA’s Genesis mission, in a “cleanroom”.
Designing an analytical strategy for isotopic analysis • How much material do you have available for analysis? • - often set by external factors (no sample is unlimited) • What is the expected concentration of the isotopes of interest? • What is the error on the isotope ratio expected from counting statistics? • What are the other sources of error? • - blanks (know the sources of contamination and their isotopic signatures) • Is the expected/desired isotopic signal larger than the sum of all expected errors? • yes? proceed • no? back to square one – can you use more sample? limit blanks? etc • What instrument will deliver you the required precision? • What particular sources of error are associated with this analysis technique? • - poor yield from sample injection to detection (lowers N) • - mass fractionation, abundance sensitivity, etc • 8. Is the expected/desired isotopic signal larger than the sum of all expected errors?
A review of terms accuracy: how close the measurement is to a true value precision: how well we can measure something analytically Good science: quote values that are accurate within the precision Systematic error: cannot be assessed by repeated measurements (ex?) Random error: can be assessed by repeated measurements (ex?) Internal error: measure ratio repeatedly, assess scatter (aka precision) External error: compare measurements of standards with internal errors to truth (aka accuracy)
Systematic error Examples: detector gain (only counts a fraction of signal, usually close to 1) uncorrected blank or “memory” wrong mass discrimination law assumed spike calibration not accurate • Reducing systematic errors: • minimize systematic errors, add them to random errors • make sure systematic errors are small compared to random errors (<10%) • measure unknowns relative to a standard so systematic errors cancel out • * Different applications require different approaches (2 & 3 most popular in mass spec work) How do you hunt for systematic errors?
Counting Statistics: problem of counting subset of a large set (sometimes the subset will reflect the large set, sometimes over-estimate, sometimes under-estimate) theoretical limit: 68% chance of being within of measured values so need 10,000 realizations to get 1% error (at 68% confidence, or 1s) Random error Internal error: derives from imperfect measurement (collector noise, electronic noise, etc) measure ratio repeatedly and use scatter to assess uncertainty External error: the ability to reproduce standards over many runs (why might this change long-term?) measure standard repeatedly, over a very long time cite as 2 s.d. and mention how many standards based on Ex.: “External reproducibility was assessed with repeated measurements of the NBS-19 carbonate standard, and is reported as ±0.05‰ (2 s.d., N=550).”
Example – U isotope ratios in single run Statistic 1) mean = 140.0833 2) standard deviation (1s) = 0.038 * variance = (s)2 3) standard error (1s) = 0.0027 4) relative standard error (1s) = 1.93 x 10⁻⁵ What is the 238U/235U ratio in nature? What sources of error are implicit in this plot?
Probability density equation: MEAN +1s -1s -2s range CI +2s 0.6826895 0.9544997 Frequency 0.9973002 0.9999366 0.9999994 238U/235U ratio The Gaussian, or “normal” distribution
MEAN +1s -1s -2s +2s Frequency 238U/235U ratio Fun with Gaussian statistics How many measurements should fall outside the 2s boundaries? Would the distribution for many standard runs be greater or smaller than for individual runs? How could you test whether a process is Gaussian? Would the shape of this distribution change with more measurements? What’s limiting the precision of this measurement?
A note on error propagation Addition and subtraction: square root of sum of squared absolute errors Example: subtracting a blank blank = 230 ± 20 pg 230Th measurement = 3532 ± 50 pg 230Th blank-corrected 230Th = 3302 ± 70 pg 230Th multiplication and division: square root of sum of squared relative errors Example: correcting value for mass discrimination by normalizing to standard value mass discrimination = std ratio(meas) / std ratio(true) = 1.003322 ± 0.01% unknown ratio = 1932 ± 10 or 1932 ± 0.52% m.d.-corrected ratio = 1926 ± 0.53% Usually you are dealing with multiple sources of error errors from…. mass spectrometry 2 s.d. external weighing 2 s.d. of repeat measurements on balance spike calibration 2 s.d. of repeat spike calibration attempts blank correction 2 s.d. of blank variability IF errors are unrelated (orthogonal) – no error correlation (examples?) then combine errors quadratically
A reminder about significant figures • Number of significant figures: • leftmost nonzero digit is the most significant digit • if there is no decimal point, rightmost nonzero digit is the least significant digit • if there is a decimal point, the rightmost digit is the least significant digit (0 included) • all digits between the least and most significant digits are counted as significant digits • Example: • How many significant figures in the following numbers? • 1234 • 123,400 • 123.4 • 1001 • 10.10 • 0.0001010 • 100.0 • NOTE: When performing calculations with data, the number of significant figures in the answer • must be equal to the smallest number of significant figures in the input data • Rules for reporting data: • Do not report data as more precise than the error (internal or external). • Example: mass spec printout reads -5.322‰, external error = ±0.05‰, report as -5.32‰
Linear regression, R-value, and slope uncertainty • Fitting your data to a linear model y=ax+b • Questions to ask yourself: • which is my dependent (x) and independent (y) variable? • - if error in both variables, then use • total least squares (minimize residuals • in both x and y) versus • ordinary least squares (y only) • 2) How do I interpret my R value? • R2 represents the amount of variance • that are you explaining with the • relationship, in % • Ex: if R=0.6, then you are explaining • 36% of the variance in your variables • 3) What is the uncertainty in my slope? • can use LINEST in Excel • if the slope is used in a calculation, the • uncertainty in slope must be propagated through
Assessing the significance of an R-value Is the relationship between x and y significant? Note: you can have a very high R-value that is meaningless! Can use several approaches, most common is the Student’s T-test, where you are testing whether your R value is significantly different from ‘0’, given your degrees of freedom. Table at right uses a Pearson’s Product-Moment Correlation Coefficient. Ex: For 7 sample pairs of x and y, I have 5 degrees of freedom. I need an R-value of ≥0.754 for a 95% significance. ≥0.874 for a 99% significance. http://www.gifted.uconn.edu/siegle/research/correlation/corrchrt.htm
Determining your need for clean Every geochemical measurement must be corrected for a blank. In general, the blank correction should be at least an order of magnitude less than the analytical error of the measurement. Your relative blank contribution depends on: - the concentration of the element of interest and the amount of sample available - the amount of contaminants that will be incorporated into the sample (depends on analytical technique) Three scenarios (Nspl*Rspl + Ncont*Rcont)/Ntotal = Rfinal • 14C/12C in carbonates • introduction of modern CO2 gas • during conversion of sample CaCO3 • to CO2 is fatal • blanks are extremely important • conversion performed in evacuated • vacuum line • -blanks carefully monitored 18O/16O in carbonates -oxygen is 48% of CaCO3 by weight -but we can measure R of small samples precisely (~0.005%) -atmospheric CO2, water vapor must be limited during analysis U-Th isotopes in carbonates -U is 3ppm in carbonates Th is ultra-trace -not easy to contaminate U, but very easy to contaminate Th
How clean is clean? A cleanroom is a fully-enclosed laboratory that is: 1. maintained at positive pressure 2. fed by filtered air 3. inhabited by scientists in white labcoats, booties, gloves, and hats 4. constructed entirely of white plastic (usually) Cleanroom specifications range from class 10,000 to class 1. Cleanliness costs time and money (~$500,000 to $2M). NOTE: they only prevent particulate contaminants.
Which analyses need to be conducted in a clean room? • 14C/12C in carbonates • introduction of modern CO2 gas • during conversion of sample CaCO3 • to CO2 is fatal • blanks are extremely important • conversion performed in evacuated • vacuum line • -blanks carefully monitored 18O/16O in carbonates -oxygen is 48% of CaCO3 by weight -but we can measure R of small samples precisely (~0.005%) -atmospheric CO2, water vapor must be limited during analysis U-Th isotopes in carbonates -U is 3ppm in carbonates Th is ultra-trace -not easy to contaminate U, but very easy to contaminate Th Maybe. You cannot prevent CO2 from entering a cleanroom. but Particulates may contain modern CO2 (esp. if biologists using tracer 14C are nearby), so limiting sample exposure to particulates can be important. No. You cannot prevent H2O(g) from entering a cleanroom. Definitely. Your Th blank would render your analysis useless.
Chemical separation If the isotope of interest is present in low concentrations (ppm and lower), a chemical separation is often required prior to analysis. benefits: -reduces mass interferences -improves conversion of atoms to ions (ionization efficiency) Usually achieved by column chromatography Principle: -it’s a competition between sample ions and acid ions for the binding sites on the resin -ions have different binding strengths to resin beads, can be pulled off with specific acids • example of cation exchange reaction: • this reaction is associated with a K-value that is specific • to the acid and ion in question M+ + H-R M-R + H+
Column Chromatography Procedure: 1) sample pre-concentrated, converted to solution form 2) anion or cation exchange resin slurry loaded into column 3) sample loaded 4) progress through sequence of eluants (acids of different strengths) 5) collect fractions of interest