
Peppered Moth Study
E N D
Presentation Transcript
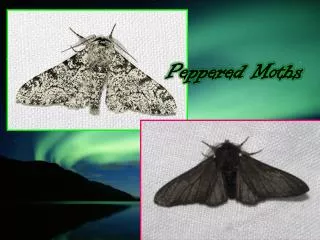
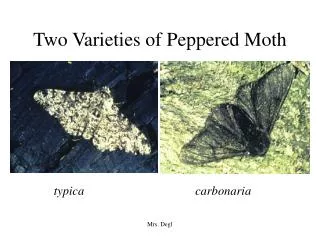
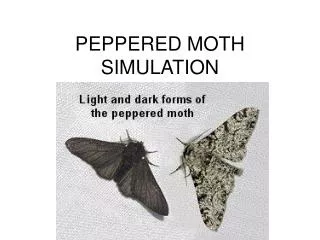
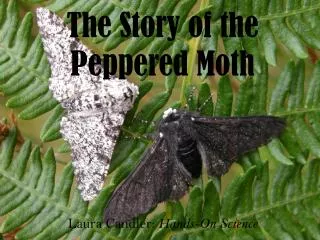
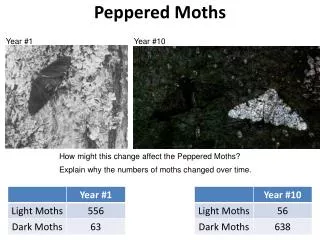
Peppered Moth Study Industrial melanism is the term used to describe the adaptation of an organism in response to industrial pollution. One example of rapid industrial melanism occurred in the peppered moth in the area of Manchester, England from 1845 to 1890. Before the Industrial Revolution, the trees in the forest around Manchester were light grayish green due to the presence of lichens on their trunks. Peppered moths, which lived in the area, were light with dark spots. Their coloring served as camouflage against predators. As the industrial revolution progressed, the trees became covered with sulfur dioxide, turning the tree trunks dark. Over a period of 45 years, the peppered moth population changed to a predominantly dark species, with only a few light-colored individuals remaining. The following simulation will allow you to observe the effects of industrial melanism in the peppered population after several generations.
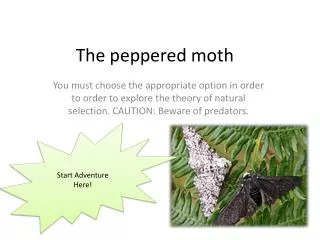
Peppered Moth Study: • You have been turned into a bird whose main diet is the peppered moth. The trees that the moths rest on are light in color. • Move about an arm’s length away from the computer screen and click and drag the first 50 moths you see to the bird diagram on the left of the screen. • Remove the background and record your data in a chart. • Copy the moths remaining and paste once. (Shift and click on each then apple C(copy), apple v(paste) once) • This represents the offspring. Then replace the background and repeat the procedure above one more time. Share your two sets of data by posting them to the Wikispace.
Data Analysis: • Choose 7 data samples from 7 other teams posted on the Wikispace for the number of light- and dark-colored moths that survived on the light-colored tree trunks. • Choose another 7 data samples from 7 other teams posted on the Wikispace for the number of light- and dark-colored moths that survived on the dark-colored tree trunks. • Graph your data and answer the questions that follow.
Effects of Sulfur Dioxide on moth survival: • Complete the next simulation using the dark-colored tree trunks. Record your data on the same graph.
Data Analysis: 1. Using the data from your graph, draw a conclusion concerning the population of peppered moths in this sample. (Which moths survived better in each case? Why?) • How may the first dark colored moth have been produced? • Predict what would happen to the population of the peppered moths if the environment was cleaned? 4. How may other types of pollution affect the way a population in of a certain species in your area changes over time? Post your response to this question on the Wikispace.