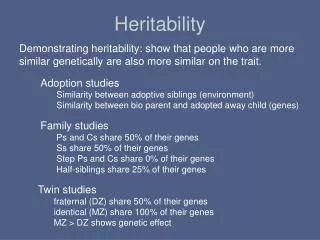
Lecture 4: Heritability
Lecture 4: Heritability. Heritability. Narrow vs. board sense. Narrow sense: h 2 = V A /V P. Slope of midparent-offspring regression (sexual reproduction). Board sense: H 2 = V G /V P. Slope of a parent - cloned offspring regression (asexual reproduction).

Lecture 4: Heritability
E N D
Presentation Transcript
Heritability Narrow vs. board sense Narrow sense: h2 = VA/VP Slope of midparent-offspring regression (sexual reproduction) Board sense: H2 = VG/VP Slope of a parent - cloned offspring regression (asexual reproduction) When one refers to heritability, the default is narrow-sense, h2 h2 is the measure of (easily) usable genetic variation under sexual reproduction
Why h2 instead of h? Blame Sewall Wright, who used h to denote the correlation between phenotype and breeding value. Hence, h2 is the total fraction of phenotypic variance due to breeding values Heritabilities are functions of populations Heritability values only make sense in the content of the population for which it was measured. Heritability measures the standing genetic variation of a population, A zero heritability DOES NOT imply that the trait is not genetically determined
Heritabilities are functions of the distribution of environmental values (i.e., the universe of E values) Decreasing VP increases h2. Heritability values measured one one environment (or distribution of environments) may not be valid under another Measures of heritability for lab-reared individuals may be very different from heritability in nature
Heritability and the prediction of breeding values If P denotes an individual's phenotype, then best linear predictor of their breeding value A is The residual variance is also a function of h2: The larger the heritability, the tighter the distribution of true breeding values around the value h2(P - mP) predicted by an individual’s phenotype.
Heritability and population divergence Heritability is a completely unreliable predictor of long-term response Measuring heritability values in two populations that show a difference in their means provides no information on whether the underlying difference is genetic
Traits more closely associated with fitness tend to have lower heritabilities Sample heritabilities
Trait value in sib j from family i Deviation of sib j from the family mean Common Mean Effect for family i = deviation of mean of i from The common mean Estimation: One-way ANOVA Simple (balanced) full-sib design: N full-sib families, each with n offspring One-way ANOVA model: zij = m + fi + wij s2f = between-family variance = variance among family means s2w = within-family variance s2P = Total phenotypic variance = s2f + s2w
Covariance between members of the same group equals the variance among (between) groups The variance among family effects equals the covariance between full sibs The within-family variance s2w = s2P - s2f,
Since Estimating the variance components: 2Var(f) is an upper bound for the additive variance
Nice fact: Under normality, the (large-sample) variance for a mean-square is given by ) ( ) ( Assigning standard errors ( = square root of Var)
- - - Hence, h2 < 2 tFS Estimating heritability An approximate large-sample standard error for h2 is given by
VA < 10 h2 < 2 (5/25) = 0.4 Worked example 10 full-sib families, each with 5 offspring are measured
Full-sibs Half-sibs Full sib-half sib design: Nested ANOVA
Value of the kth offspring from the kth dam for sire i Effect of sire i = deviation of mean of i’s family from overall mean Within-family deviation of kth offspring from the mean of the ij-th family Effect of dam j of sire i = deviation of mean of dam j from sire and overall mean Overall mean Estimation: Nested ANOVA Balanced full-sib / half-sib design: N males (sires) are crossed to M dams each of which has n offspring Nested ANOVA model: zijk = m + si + dij+ wijk s2s = between-sire variance = variance in sire family means s2d = variance among dams within sires = variance of dam means for the same sire s2w = within-family variance s2T = s2s + s2d + s2w
Nested Anova: N sires crossed to M dams, each with n sibs, T = NMn
s2w = s2z - Cov(FS) Estimation of sire, dam, and family variances: Translating these into the desired variance components • Var(Total) = Var(between FS families) + Var(Within FS) • Var(Sires) = Cov(Paternal half-sibs)
Summarizing, Expressing these in terms of the genetic and environmental variances,
4tPHS = h2 h2 < 2tFS Intraclass correlations and estimating heritability Note that 4tPHS = 2tFS implies no dominance or shared family environmental effects
Single parent - offspring regression The expected slope of this regression is: Residual error variance (spread around expected values) ( ) Shared environmental values To avoid this term, typically regressions are male-offspring, as female-offspring more likely to share environmental values Parent-offspring regression
Midparent - offspring regression Key: Var(MP) = (1/2)Var(P) Residual error variance (spread around expected values) ) ( ( ) The expected slope of this regression is h2, as Hence, even when heritability is one, there is considerable spread of the true offspring values about their midparent values, with Var = VA/2, the segregation variance
Single parent-offspring regression, N parents, each with n offspring Squared regression slope Sib correlation Total number of offspring • Midparent-offspring variance half that of single parent-offspring variance Standard errors Midparent-offspring regression, N sets of parents, each with n offspring
A lower bound can be placed of heritability using parents from nature and their lab-reared offspring, ) ( where Covariance between breeding value in nature and BV in lab is the additive genetic covariance between environments and hence g2 < 1 Estimating Heritability in Natural Populations Often, sibs are reared in a laboratory environment, making parent-offspring regressions and sib ANOVA problematic for estimating heritability Why is this a lower bound?
Genotype i Environment j Effect of plot k for Genotype I in environment j deviations of individual Plants within this plot Interaction between Genotype I and environment j Number of Environments Number of plots/environment Number of individuals/plot Defining H2 for Plant Populations Plant breeders often do not measure individual plants (especially with pure lines), but instead measure a plot or a block of individuals. This can result in inconsistent measures of H2 even for otherwise identical populations. If we set our unit of measurement as the average over all plots, the phenotypic variance becomes Hence, VP, and hence H2, depends on our choice of e, r, and n