Download
1 / 13
130 likes | 287 Vues
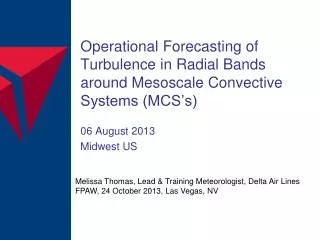
Operational Forecasting of Turbulence in Radial Bands around Mesoscale Convective Systems (MCS’s). 06 August 2013 Midwest US. Melissa Thomas, Lead & Training Meteorologist, Delta Air Lines FPAW, 24 October 2013, Las Vegas, NV. Turbulence and Cloud bands.

E N D
Operational Forecasting of Turbulence in Radial Bands around Mesoscale Convective Systems (MCS’s) 06 August 2013 Midwest US Melissa Thomas, Lead & Training Meteorologist, Delta Air Lines FPAW, 24 October 2013, Las Vegas, NV
Turbulence and Cloud bands DAL experience, and recent research, has shown a strong correlation between radial bands and turbulence experienced by aircraft in the vicinity of the bands. A correlation to turbulence also appears to exist in cirrus bands associated with jet streams and synoptic scale systems.
Timing of band development- Climatology Four-Year (2003-2006) June-August Climatology of 25% of Heaviest Rain Cases over 100 W to 90 W Longitude (e.g., W Kansas- W Illinois) 1. Identify location/ time of max precip 2. Identify time of max wind shear Time (hour UTC) North Latitude (degrees) • RUC analyzed 200-mb zonal wind enhancement (left) several hundred km north and several hours after heaviest rainfall with nocturnal convection • Leads to enhanced vertical shear near flight levels (right) in similar location persisting for several hours beyond sunrise and enhanced threat of turbulence from lowering of Richardson Number Taken from Trier, S. B., and R. D. Sharman, 2009: Mon. Wea. Rev., 137, 1972–1990
Location of turbulence related to MCS • Identify direction of environmental jet • Choose quad of storm where MCS outflow = environ. Jet Vertical Wind Profiles from Different Sides of MCS Anvil Edge Environmental Flow MCS-Induced Flow Total Flow • Strong vertical shear at flight levels due almost entirely to MCS outflow on north side (top) • Vertical shear at flight levels on south side (bottom) weaker because easterly outflow winds and shear are opposed by their westerly environmental (adiabatic) counterparts Taken from Trier, S. B., and R. D. Sharman, 2009: Mon. Wea. Rev., 137, 1972–1990
Cross section along the band-altitudes of turbulence • Radial bands • develop in • unstable • anvil region Red Line: Richardson Number < 0 = unstable • Gravity wave • turbulence • extends far • below anvil Red = Upward Motion Blue = Downward Motion Trier et al., 2010: JAS, 2990-2999.
What we need to know when forecasting bands • Timing, location, and altitudes of turbulence related to the radial bands • Max precip location: GFS/ NAM/ HRRR/ WRF • Anvil: GFS 250-200mb Relative Humidity % • Wind shear: Maximum shear vectors (near anvil layer) • Altitudes?
Locate MCS-max precipitation • Step #1: • Identify location of maximum precipitation (MCS) *may have to use HRRR or WRF for better MCS precip location surface precip / 250-300mb shear vectors
Identify MCS anvil • Step #2: display upper level (200mb) relative humidity • Identify area of anvil cloud shield where bands could develop
Determine quad of enhanced wind speed • Step #3: display upper level winds • Identify environmental wind direction and locate corresponding outflow area of MCS Max winds / 200-250mb shear vectors / precip
Identify strongest wind shear • Step #4: Radial bands develop in strongest wind shears and will align with the shear vectors • Locate area of maximum shear vectors in the quadrant of the MCS (in Step #3)
Choosing altitudes - Forecast sounding Turbulence is most likely in the anvil/cloud bands. DAL experience also suggests that the altitudes of turbulence extend far below the anvil in the area of the gravity waves. 12z Anvil Turbulence?
1445z color IR 3hrs of pireps: LGT-MOD chop FL290-390 worst alts FL290-350 1645z IR with pireps: black=smooth, green=lgt, yellow=lgt/mod, orange = mod
Limitations & Conclusions Limitations • Operational Models: data very coarse resolution • Does not always forecast bands well for timing / location • Timing: In this example, bands developed 13-14z instead of earlier forecast time 10-12z • Location: models do not provide guidance for choosing altitudes. • Forecasting altitudes more of an educated guess Conclusions • Research to Operations: CIT research (Sharman, Trier et al.) has allowed Delta Airlines to develop forecasting methods for CIT/radial bands that improve upon current turbulence model forecast limitations. • Human-in-the-Loop:This example illustrates how an operational meteorologist can provide additional product value, using current models, combined with the latest research.