Download
1 / 55
550 likes | 667 Vues
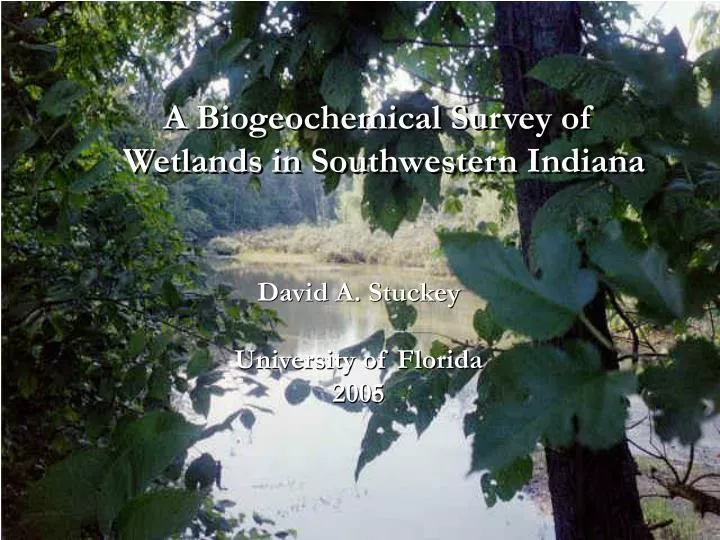
A Biogeochemical Survey of Wetlands in Southwestern Indiana. David A. Stuckey University of Florida 2005. Wetland Functions and Benefits . Water Resources Flood Control: Water storage Reduce flow velocity and dampen peaks or runoff Water Quality:

E N D
A Biogeochemical Survey of Wetlands in Southwestern Indiana David A. Stuckey University of Florida 2005
Wetland Functions and Benefits • Water Resources • Flood Control: • Water storage • Reduce flow velocity and dampen peaks or runoff • Water Quality: • Absorb excess organic and inorganic nutrients from fertilizer and septic system runoff • Filter sediments and trap pollutants such as pesticides and metals, for storage or recycling within the wetland system
Wetland Functions and Benefits • Biological/Ecological • Erosion Control • Roots bind soil, vegetation absorbs wave energy • Fisheries • Habitat and food sources • Spawning and nursery grounds • Wildlife • ~900 vertebrate species require wetlands during some period in their life cycles
Wetland Functions and Benefits • Biological/Ecological • Wildlife • Principal habitat for waterfowl and other birds, mammals, reptiles and amphibians • Excellent habitat for non-wetland-dependent species • ~35% of all rare and endangered species wetland-dependent • Recreation • 75,000 user days/year in Indiana by duck and goose hunters • >1,000,000 user days/year of non-consumptive recreation
Human Actions - Drainage- Dredging/Stream Channelization- Deposition of fill material- Diking and damming- Tiling for crop production- Levees- Logging- Mining- Construction- Runoff- Air and water pollutants- Changing nutrient levels- Releasing toxic chemicals- Introducing nonnative species- Grazing by domestic animals Natural Disturbance - Erosion- Subsidence- Sea level rise- Droughts- Hurricanes and other storms Major Causes of Wetland Loss and Degradation
Patoka River National Wildlife Refuge protects one of the most significant bottomland hardwood forests remaining in the Midwest.
Nutrient concentration levels play a critical role in the integrity and functionality of wetlands. To fully assess the status and condition of wetland ecosystems, knowledge of nutrient flow and cycling is required. Although water quality nutrient data is readily available for many water bodies, there is limited information regarding nutrient concentrations in wetlands especially within the soil and vegetation at wetland sites. Background
Background • 1972 Clean Water Act required states to establish designated uses for water bodies, and to establish protective criteria for those uses. • 1998 Clean Water Action Plan required states to establish numeric nutrient criteria instead of narrative criteria.
Background • EPA would like to recommend numeric criteria be set at the ecoregion level, however some ecoregions cover broad latitude and longitudinal areas. • In addition, wetland strata most representative of nutrient condition across these broad regional scales is unknown.
Southern Temperate Forests Plains and Hills (IX) Southern Coastal Plain (XII) Eastern Coastal Plain (XIV) Ecoregions IX, XII and XIV
Rationale • To address this need for consistency and comparability in the reporting data, as well as establishment of numeric criteria, an EPA-funded project, Southeastern Wetlands Biogeochemical Survey, was conducted. • A biogeochemical survey of wetlands of Southwestern Indiana was conducted as a geographical subset.
Objectives • Survey dominant wetland types in Southwestern Indiana • Evaluate appropriate aggregation of wetland communities • Determine which sampling strata (water, litter, soil, vegetation) is most responsive to nutrient enrichment. • Contrast Indiana reference wetlands to Southeastern US wetlands in Ecoregion IX to determine validity of a single numeric criteria.
Sample Site Selection • Southwestern Indiana Wetland Biogeochemical Survey • Southeastern U.S. Wetlands Biogeochemical Survey • Hydrologic Connectivity • Riparian • Non-Riparian • Vegetative Classification • Swamp • Marsh • Nutrient Condition • Impacted • Least-Impacted
Hydrologic Connectivity • Wetlands were distinguished by hydrologic connectivity, as riparian or non-riparian. • If the wetland perimeter was located within 40 meters of an adjacent stream or river, it was classified as riparian.
Vegetative Classification • Based on the dominant vegetative community, sites were divided into swamps or marshes. • Swamps were characterized by woody vegetation at least six meters in height. • Marshes were typically emergent wetlands with erect, rooted, herbaceous hydrophytes present
Vegetative Classification Riparian Swamp Non-Riparian Marsh Non-Riparian Swamp
Vegetative Classification Riparian Swamp Non-Riparian Swamp Non-Riparian Marsh
Sampling Site Selection • Wetland sampling sites were identified by: • Topographical and Aerial Maps • USFWS National Wetlands Inventory Database • Indiana Geological Survey’s GIS Atlas. • In consultation with: • Natural resource professionals from the USFWS • Indiana DNR • Indiana Chapter of the Nature Conservancy
Wetland Community Types Surveyed in the Southeastern United States (Greco 2004.) (Paris 2005).
Impacted sites = 94 Least impacted = 115 Eastern Coastal Plain (XIV) Southern Costal Plain (XII) Southeastern Forested Plain (IX) Southeastern Wetland Biogeochemical Survey
Site Sampling • Sites were surveyed for twenty biogeochemical indicators including plant, litter, soil and water column nutrient parameters. • An adjacent land use assessment was conducted prior to sampling. • Based on characterization of adjacent land use, the wetlands were classified as impacted or least-impacted.
“Reference” Wetlands • Recognizing that all wetlands are impacted by anthropogenic activities to some degree, it was presumed that the least-impacted sites would represent a reference condition that was not significantly disturbed such that the ecological integrity of the site is unimpaired. • These reference, or least impacted wetlands can be used to define EPA’s numeric nutrient criteria.
Sampling Scheme • Three Transects • Transect A (inner wetland) • Transect B (outer wetland • Upland • Composite Sampling • Three samples into one sample/transect • Vegetation Sampling • Throughout wetland
B) Small non-riparian A) Riparian (a) B1 A1 B1 A Upland A1 Center B2 B3 A3 A2 A2 Edge B2 B3 A3 Ecotone (not sampled) Upland Edge Center River Upland A1 B1 A2 Center B2 A3 B3 Edge C) Large non-riverine Sampling Scheme
Sampled Strata • Water • Grab sample (if present) • Soil • Top 10 cm of Soil • Litter • Grab sample • Vegetation • Sampled by species presence
Laboratory Analysis • All samples shipped to Wetland Biogeochemical Laboratory for analysis • Soil • Total Phosphorus (TP), Total Nitrogen (TN), Total Carbon (TC) • Litter • TP, TN, TC • Vegetation • TP, TN, TC • Water • TP, TN
Objective 1 (Results) Evaluate appropriate aggregation of wetland communities:
Water Column No significant differences in water column TN or TP among the aggregation Significant differences determined by Tukey’s HSD at a = 0.05
Litter Significant differences were found between riparian and non-riparian TP Significant differences determined by Tukey’s HSD at a = 0.05
Soil Significant differences were found between riparian and non-riparian TN Significant differences determined by Tukey’s HSD at a = 0.05
Vegetation No significant differences were found in TN and TP Significant differences determined by Tukey’s HSD at a = 0.05
Objective 1 (Conclusions) • Based on the results for water column or vegetation nutrient indicators, separation by wetland community type does not appear to be required for assessment. • For litter TP, a distinction should be considered between riparian and non-riparian wetlands. • For soil TN, a distinction should be considered between riparian and non-riparian wetlands.
Objective 2(Results) Determine which sampling strata (water, litter, soil or vegetation) is most responsive to nutrient enrichment :
Nutrient Indicator Strata Wetland Nutrient Condition There were no significant differences in water column TP or TN. There were no significant differences in vegetation TP or TN There were no significant differences in litter TP or TN There were significant differences in soil TP or TN.
Objective 2 (Conclusions) • Based on the results, water column, litter and vegetation samples analyzed for TP and TN do not indicate nutrient enrichment in wetlands. • Only soils were able to distinguish between impacted and least-impacted wetlands.
Objective 3 (Results) Contrast SW Indiana reference wetlands to Southeastern US wetlands in Ecoregion IX to determine validity of a single numeric criteria:
Water Column Total Phosphorus Water column TP was significantly different b a a a Indiana Alabama Florida Georgia
Water Column Total Nitrogen Water column TN was not significantly different a a a a Indiana Alabama Florida Georgia
Indiana Alabama Florida Georgia South Carolina Litter Phosphorus Litter TP was significantly different among some areas of ecoregion IX bc c c ab a
Indiana Alabama Florida Georgia South Carolina Litter Nitrogen Litter TN was significantly different with sites in the state of Florida b b b ab a
Indiana Alabama Florida Georgia South Carolina Vegetative Tissue Phosphorus Vegetation TP was significantly different from sites in Florida ab b b ab a
Indiana Alabama Florida Georgia South Carolina Vegetation Tissue Nitrogen Vegetation TN was significantly different from sites in Florida b b ab ab a