Simulation analysis using stock synthesis
Simulation analysis using stock synthesis. Maunder, Piner, and Lee. Objective. Use the SS2/SS3 program as a simulator to test the ability to estimate key model parameters. SS2 bootstrap. Built in bootstrap procedure to generate artificial data files

Simulation analysis using stock synthesis
E N D
Presentation Transcript
Simulation analysis using stock synthesis Maunder, Piner, and Lee
Objective • Use the SS2/SS3 program as a simulator to test the ability to estimate key model parameters
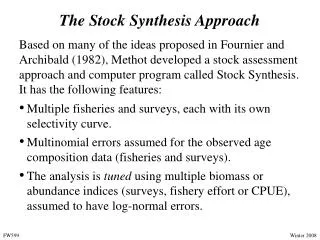
SS2 bootstrap • Built in bootstrap procedure to generate artificial data files • Data files have randomly generated data based on the same characteristics of the real data • Data file in the SS2 format and can be used directly to run the model • Data files are in a single file one on top of the other and need to be separated • Use data files to run bootstraps, and estimate uncertainty and bias • Can also be used to generate data based on fixed parameter values • (note in SS3 first data set is the actual and second is with no error)
Simulation algorithm for estimating M(based on Ian Stewart’s R code) • Run the original model to generate the bootstrap files (M fixed) • Set the number of bootstrap files to 500 in the starter.ss file • Split out the data files into separate files, put them in separate directories with the model files • Set the bootstrap files to 0 • Set M to a positive phase • Set it to start from par file in the starter.ss file to make it run faster • Run the assessment in each directory • Do this by creating a batch file that moves through the directories and runs the model • Read in the results from each run
Methods • Use current peer reviewed SS2 assessments • Use the exact setup used in the assessment, including model assumptions, parameters estimated, and data • Estimate any Ms that are different (e.g. old/young, male/female)
Species • Arrowtooth flounder • Black rockfish-North • Black rockfish-South • Chilly pepper rockfish • Pacific cod • Cowcod • Dark blotch rockfish • English sole • Hake • Longnose skate • Blue rockfish • Sablefish • Yelloweye rockfish
Indication of statistical assumption violation (incorrect sample size or residual patterns)
Modification for estimating steepness of the stock recruitment relationship • Run the original model • Set the maximum phase to 0 in the starter file and use the par file (i.e. simulate data from fixed parameter values) • Replace the recruitment deviates in the par file with a N(0,Rsd) • Run one bootstrap • Estimate the model parameters • Repeat 3-5 500 times • Summarize results
Results for Pacific cod • Estimates of steepness equal to one • Even if h=0.5 • Only gets estimates < 1 if h=0.5 and Rsd = 0.2 • Need to try on the other stocks
Other examples • Estimating the growth parameters • Does iterative reweighting improve the results • Can observation error adjust for process error • MSE
Acknowledgements • Stacey Millar and all the assessment authors