CHI SQUARE TESTS
CHI SQUARE TESTS. Parametric and Nonparametric Tests. This lesson introduces two non-parametric hypothesis tests using the chi-square statistic: the chi-square test for goodness of fit and the chi-square test for independence. . Parametric and Nonparametric Tests (cont.).


CHI SQUARE TESTS
E N D
Presentation Transcript
Parametric and Nonparametric Tests • Thislesson introduces two non-parametric hypothesis tests using the chi-square statistic: the chi-square test for goodness of fit and the chi-square test for independence.
Parametric and Nonparametric Tests (cont.) • The term "non-parametric" refers to the fact that the chi‑square tests do not require assumptions about population parameters nor do they test hypotheses about population parameters. • Previous examples of hypothesis tests, such as the t tests and analysis of variance, are parametric tests and they do include assumptions about parameters and hypotheses about parameters.
Parametric and Nonparametric Tests (cont.) • The most obvious difference between the chi‑square tests and the other hypothesis tests we have considered (t and ANOVA) is the nature of the data. • For chi‑square, the data are frequencies rather than numerical scores.
Nonparametric Statistics • A special class of hypothesis tests • Used when assumptions for parametric tests are not met • Review: What are the assumptions for parametric tests?
Assumptions for Parametric Tests • Dependent variable is a scale variable interval or ratio • If the dependent variable is ordinal or nominal, it is a non-parametric test • Participants are randomly selected • If there is no randomization, it is a non-parametric test • The underlying population distribution is normal • If the shape is not normal, it is a non-parametric test
When to Use Nonparametric Tests • When the dependent variable is nominal • What are ordinal, nominal, interval, and ratio scales of measurement? • Used when either the dependent or independent variable is ordinal • Used when the sample size is small • Used when underlying population is not normal
Limitations of Nonparametric Tests • Cannot easily use confidence intervals or effect sizes • Have less statistical power than parametric tests • Nominal and ordinal data provide less information • More likely to commit type II error • Review: What is type I error? Type II error?
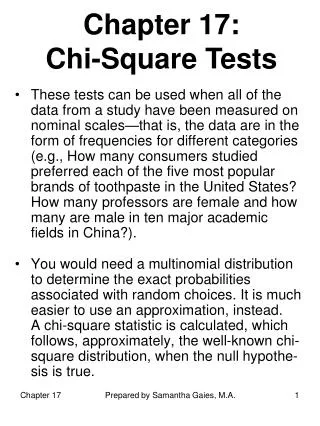
The Chi-Square Test for Goodness-of-Fit • The chi-square test for goodness-of-fit uses frequency data from a sample to test hypotheses about the shape or proportions of a population. • Each individual in the sample is classified into one category on the scale of measurement. • The data, called observed frequencies, simply count how many individuals from the sample are in each category.
The Chi-Square Test for Goodness-of-Fit (cont.) • The null hypothesis specifies the proportion of the population that should be in each category. • The proportions from the null hypothesis are used to compute expected frequencies that describe how the sample would appear if it were in perfect agreement with the null hypothesis.
Chi-Square test for goodness of fit- An Example -Is the frequency of balls with different colors equal in our bag? Observed Frequencies Expected Frequencies
Chi-Square test for goodness of fit Observed Frequencies Total 120 ExpectedFrequencies 120 = Expected Frequencies H0
Difference Normalize Chi-Square test for goodness of fit Observed Frequencies Expected Frequencies
Chi-Square test for goodness of fit Critical value = 7.81 26.6 2(3,n=120) = 26.66, p< 0.001
Chi-Square test for Goodness of fit • Chi-Square test for goodness of fit is like one sample t-test • You can test your sample against any possible expected values H0 H0
The Chi-Square Test for Independence • The second chi-square test, the chi-square test for independence, can be used and interpreted in two different ways: 1. Testing hypotheses about the relationship between two variables in a population, or 2. Testing hypotheses about differences between proportions for two or more populations.
The Chi-Square Test for Independence (cont.) • Although the two versions of the test for independence appear to be different, they are equivalent and they are interchangeable. • The first version of the test emphasizes the relationship between chi-square and a correlation, because both procedures examine the relationship between two variables.
The Chi-Square Test for Independence (cont.) • The second version of the test emphasizes the relationship between chi-square and an independent-measures t test (or ANOVA) because both tests use data from two (or more) samples to test hypotheses about the difference between two (or more) populations.
The Chi-Square Test for Independence (cont.) • The first version of the chi-square test for independence views the data as one sample in which each individual is classified on two different variables. • The data are usually presented in a matrix with the categories for one variable defining the rows and the categories of the second variable defining the columns.
The Chi-Square Test for Independence (cont.) • The data, called observed frequencies, simply show how many individuals from the sample are in each cell of the matrix. • The null hypothesis for this test states that there is no relationship between the two variables; that is, the two variables are independent.
The Chi-Square Test for Independence (cont.) • The second version of the test for independence views the data as two (or more) separate samples representing the different populations being compared. • The same variable is measured for each sample by classifying individual subjects into categories of the variable. • The data are presented in a matrix with the different samples defining the rows and the categories of the variable defining the columns..
The Chi-Square Test for Independence (cont.) • The data, again called observed frequencies, show how many individuals are in each cell of the matrix. • The null hypothesis for this test states that the proportions (the distribution across categories) are the same for all of the populations
The Chi-Square Test for Independence (cont.) • Both chi-square tests use the same statistic. The calculation of the chi-square statistic requires two steps: 1. The null hypothesis is used to construct an idealized sample distribution of expected frequencies that describes how the sample would look if the data were in perfect agreement with the null hypothesis.
The Chi-Square Test for Independence (cont.) • For the goodness of fit test, the expected frequency for each category is obtained by expected frequency = fe = p x n (p is the proportion from the null hypothesis and n is the size of the sample) • For the test for independence, the expected frequency for each cell in the matrix is obtained by (row total)x(column total) • expected frequency = fe = ───────────────── n
The Chi-Square Test for Independence (cont.) 2. A chi-square statistic is computed to measure the amount of discrepancy between the ideal sample (expected frequencies from H0) and the actual sample data (the observed frequencies = fo). A large discrepancy results in a large value for chi-square and indicates that the data do not fit the null hypothesis and the hypothesis should be rejected.
Chi-Square test for independence- An Example • When we have tow or more sets of categorical data (IV,DV both categorical) FO None Obama McCain Male 95 115 Female 25 110 75 210
Chi-Square test for independence- An Example • Also called contingency table analysis • H0: There is no relation between gender and voting preference (like correlation) • OR • H0: There is no difference between the voting preference of males and females (like t-test) • The logic is the same as the goodness of fit test: Comparing observed freq and Expected freq if the two variables were independent
Chi-Square test for independence- An Example FO None Obama McCain 95 Male 115 Female 25 110 75 210 None Obama FE McCain Male Female 12% 52% 36% 100%
Chi-Square test for independence In case of independence: FE None Obama McCain 95 Male Female 115 12% 52% 36% 100% Finaly: None Obama McCain FE Male Female
FE None Obama McCain 95 Male Female 210 25 Chi-Square test for independence • Another way:
Chi-Square test for independence • Now we can calculate the chi square value : FO FE
Chi-Square test for independence- An Example 2(2, n=210) = 0.35, p= 0.83 There is no significant effect of gender on vote preference Or We cannot reject the null hypothesis that gender and vote preference are independent