Chi-Square Tests
Chi-Square Tests. Chapter 13. The chi-square test for Goodness of Fit allows us to determine whether a specified population distribution seems valid.


Chi-Square Tests
E N D
Presentation Transcript
Chi-Square Tests Chapter 13
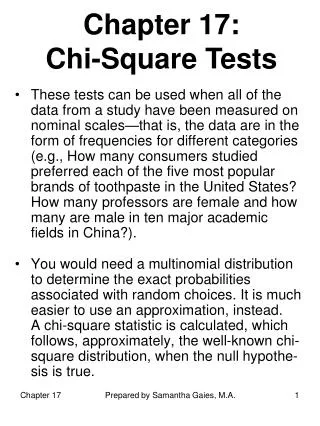
The chi-square test for Goodness of Fit allows us to determine whether a specified population distribution seems valid. The Chi-Square ( ) test is an inferential test that shows whether or not a frequency distribution fits an expected or claimed distribution.
The chi-square distribution is NOT symmetric. The shape depends on the degrees of freedom. As the number of df increases, the chi-square distribution becomes more symmetric. Otherwise, each curve is skewed right. All values are non-negative. Chi-Square has df = (number of categories) - 1
1st: State the hypothesis Ho: Frequency fits a specified distribution (actual equals hypothesized) Ha: Frequency does not fit a specified distribution. (Actual is different from hypothesized). The observed frequency (O), of a category is the frequency (count or value) of the category that is observed in the sample data. The expected frequency (E) of a category is the calculated frequency obtained assuming that the null hypothesis is true. (E=np) n=sample size p=probability
To use the chi-square goodness of fit test, the following conditions must be met: All observed data are obtained using a random sample. All expected frequencies are greater than or equal to 1. No more than 20% of the expected frequencies are less than 5.
O is the observed: Enter into L1 E is the expected: Enter into L2 L3=(L1-L2)^2/L2 For critical values, use Table C (Chi-Square Distribution)
Calculator Commands: Catalog, Sum (L3)---This is your chi-square value. Distribution, cdf(Ans, E99,df)---This is your p-value.
Chi-Squared Test of Independence • A chi-squared two-way table test is a test that determines whether two variables are: Ho: Independent/ have no association. Ha: Dependent/ have an association. Conditions: Same as χ2 GOF test. Data is randomly selected. All expected cell counts are at least 1 and no more than 20% of the expected cell counts are less than 5. df = (r-1)(c-1) r= # of rows, c= # of columns Do not include the “total” row/column.
Expected Cells • E=
Chi-Squared Test of Homogeneity • This tests the claim that several proportions are equal when samples are taken from different populations. Ho: All proportions are equal. Ha: At least one of the proportions is different from the others. df = (r-1)(c-1) Conditions: Same as other Chi-squared tests.